Global stock markets get a reality check
The Dow has taken a hammering. Is this the beginning of a bear market in stocks? John C Burford examines the charts to find out.
Get the latest financial news, insights and expert analysis from our award-winning MoneyWeek team, to help you understand what really matters when it comes to your finances.
You are now subscribed
Your newsletter sign-up was successful
Want to add more newsletters?

Twice daily
MoneyWeek
Get the latest financial news, insights and expert analysis from our award-winning MoneyWeek team, to help you understand what really matters when it comes to your finances.

Four times a week
Look After My Bills
Sign up to our free money-saving newsletter, filled with the latest news and expert advice to help you find the best tips and deals for managing your bills. Start saving today!
I have a feeling that this week will go down in stock market history as marking many all-time highs. Yesterday's panic selling was a slap in the face to the bulls and a game-changer, I believe.
There has been much comment on the peculiar nature of the US stock market rally in recent months. Much publicity has been given to the low volatility, the complacency, the lack of any serious declines and the huge and growing divergence between the booming stock market and the lackluster underlying US economy.
And while pundits have been scratching their collective heads over the amazing market performance in recent months, stocks have continued their relentless climb until this week. I have noted that a whole army of pundits have been calling for a correction' all year while the Dow has climbed barely 3% to last month's high. This seems to be the received wisdom.
MoneyWeek
Subscribe to MoneyWeek today and get your first six magazine issues absolutely FREE

Sign up to Money Morning
Don't miss the latest investment and personal finances news, market analysis, plus money-saving tips with our free twice-daily newsletter
Don't miss the latest investment and personal finances news, market analysis, plus money-saving tips with our free twice-daily newsletter
But because markets rarely satisfy the majority, the market refused to correct - until yesterday, which saw a massive 312-point decline in the Dow the largest one-day drop since January.
Also, the vast majority are calling for just a correction and then a move to new highs later in the year (another Santa Rally, perhaps?). Very few are calling for a complete collapse, as I am.
So today, I want to examine the question: have stocks finally started their much-anticipated correction (or bear market), as I believe?
Why I'm on high alert for a top
I have been working off the daily chart with my huge wedge pattern and the Elliott-wave pattern:
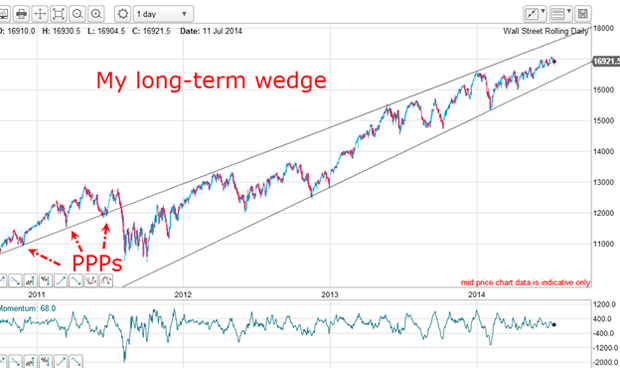
The market had scope to rally to my upper wedge line, which set my upper target. And on 17 July, the Dow made an all-time high of 17,148, which was just inside my target zone for the top. This move into my zone put me on high alert for a top.
Is this the final wedge before the decline?
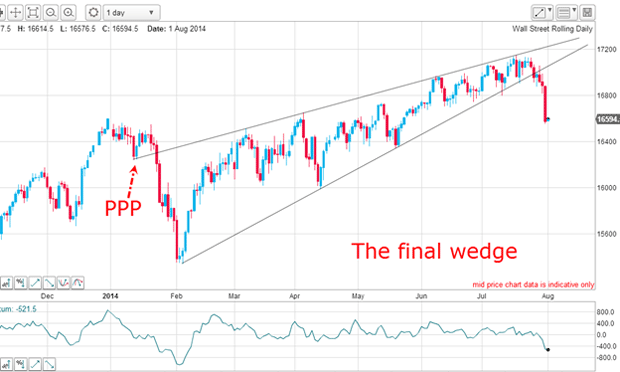
This is a truly terrific wedge! On the upper line, I have a great PPP (prior pivot point) (just like that on the first chart) and multiple accurate touch points. Similarly, my lower wedge line contains multiple accurate touch points. This is a very reliable wedge, which means that when the lower line is broken, the move is likely to be very strong in a downward direction.
And so it is proving with yesterday's sharp fall.
My trading policy on wedges is very simple: with upward-sloping wedges (which usually resolve to the downside), I set a resting sell-stop just under the lower line to position short. This method removes any emotionality when deciding whether to believe your eyes as the line is being tested! I recommend it.
Have the markets finally turned down?
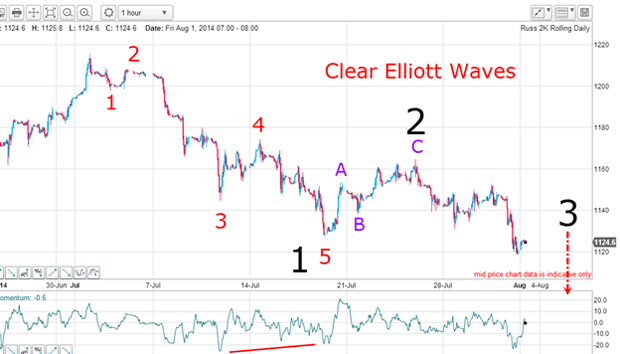
From the high made on 1 July, the waves down are pure textbook, with a long and strong w3 and a nice big positive-momentum divergence at w5. From there, we have a wonderful A-B-C upward correction, leading to a fresh decline to yesterday's move below the w5 low.
This is all part of the larger pattern where I have marked waves 1 and 2. We are now in w3 down. To confirm this, I need to see very sharp moves down.
Here's what's happening to markets around the world
Here is the S&P 500:
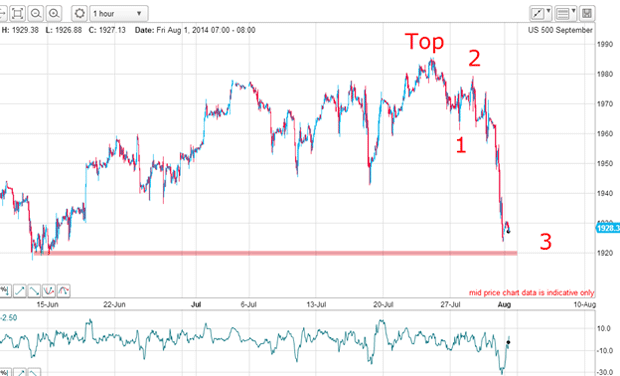
The top was made on 24 July and the market has traced out waves 1 and 2 and the long and strong move yesterday was wave 3. The market is currently testing support at the 1,920 level.
Was the selling repeated across the pond in Europe? Here is the German index:
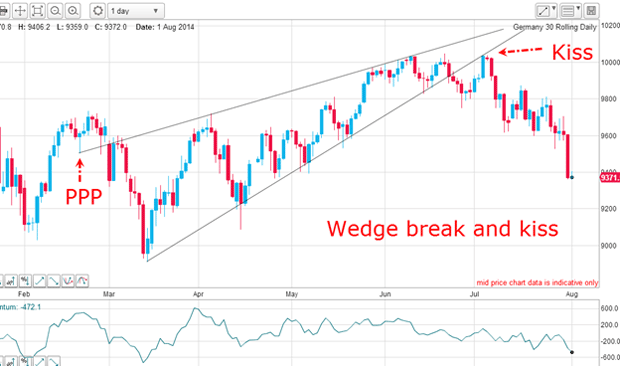
Again, I have a superb rising wedge with a PPP on the upper line. The lower line was broken in late June and the market then staged a traditional kiss and scalded-cat bounce. I have written about the power of the kiss for establishing low-risk trade entries, and this is a terrific example.
How about the French market?
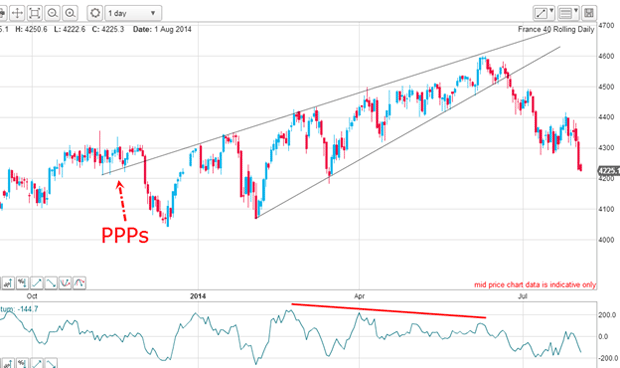
Are you seeing a pattern here? Markets have been forming wedges into their highs and when the lower line was broken, the floodgates opened. Also in every case, momentum divergences were the canary in the coal mine, warning of a coming break.
A rising wedge is like a spring being wound tighter and tighter. Eventually, the spring breaks and unwinds in a very rapid explosion.
But what about China? After all, if world economies are inter-linked, shouldn't stocks markets move more or less in parallel? Here is the Hong Kong Index:
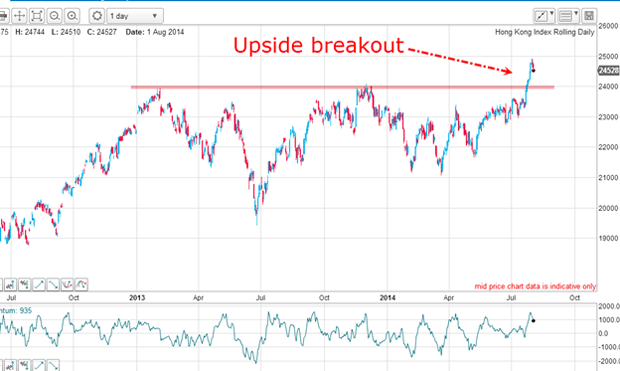
Aha! While US and European indexes have been falling, China has been breaking out to the upside! This leads me to the idea that a long China/short US spread may well work out.
Get the latest financial news, insights and expert analysis from our award-winning MoneyWeek team, to help you understand what really matters when it comes to your finances.
John is is a British-born lapsed PhD physicist, who previously worked for Nasa on the Mars exploration team. He is a former commodity trading advisor with the US Commodities Futures Trading Commission, and worked in a boutique futures house in California in the 1980s.
He was a partner in one of the first futures newsletter advisory services, based in Washington DC, specialising in pork bellies and currencies. John is primarily a chart-reading trader, having cut his trading teeth in the days before PCs.
As well as his work in the financial world, he has launched, run and sold several 'real' businesses producing 'real' products.
-
 Last chance to invest in VCTs? Here's what you need to know
Investors have pumped millions more into Venture Capital Trusts (VCTS) so far this tax year, but time is running out to take advantage of tax perks from them.
-
 ISA quiz: How much do you know about the tax wrapper?
Quiz One of the most efficient ways to keep your savings or investments free from tax is by putting them in an Individual Savings Account (ISA). How much do you know about ISAs?