Gold has been incredibly boring to own – but that’s no bad thing right now
Stocks, bonds and cryptocurrencies have all seen big falls this year. But gold remains at its one-year average. It may be dull, but it’s doing what it’s supposed to do, says Dominic Frisby. Preserving its value – and your capital.


Get the latest financial news, insights and expert analysis from our award-winning MoneyWeek team, to help you understand what really matters when it comes to your finances.
You are now subscribed
Your newsletter sign-up was successful
Want to add more newsletters?

Twice daily
MoneyWeek
Get the latest financial news, insights and expert analysis from our award-winning MoneyWeek team, to help you understand what really matters when it comes to your finances.

Four times a week
Look After My Bills
Sign up to our free money-saving newsletter, filled with the latest news and expert advice to help you find the best tips and deals for managing your bills. Start saving today!
I haven’t covered the perennial disappointment that is gold for a while, and I felt it is overdue some attention, so that will be the subject of today’s article.
I say perennial disappointment, because it “should” be so much higher. It’s summer. Usually, the best time of year to buy each year is in the June to August timeframe.
I stress “usually”, not always. A summer low in gold is frequent enough to be noticeable, but not consistent enough to be reliable. A bit like your errant teenager’s mood swings.
MoneyWeek
Subscribe to MoneyWeek today and get your first six magazine issues absolutely FREE

Sign up to Money Morning
Don't miss the latest investment and personal finances news, market analysis, plus money-saving tips with our free twice-daily newsletter
Don't miss the latest investment and personal finances news, market analysis, plus money-saving tips with our free twice-daily newsletter
In terms of price, the high for the year was $2,080 per ounce – in March, shortly after you know who invaded you know where.
The low for the year was $1,780 – that came in January. We also came close to that figure in May ($1,785 was the low).
And today we are meandering around the $1,820 mark, which is also where the 52-week moving average lies.
That’s actually quite a telling little fact. For all the declines we’ve seen elsewhere in stocks, bonds and crypto, and the ensuing erosion of wealth, gold sits at its one-year average. In other words, it’s done what it’s supposed to: preserved its value, and preserved your capital.
And that’s with the US dollar so strong.
Gold has done surprisingly well, particularly if you’re a sterling investor
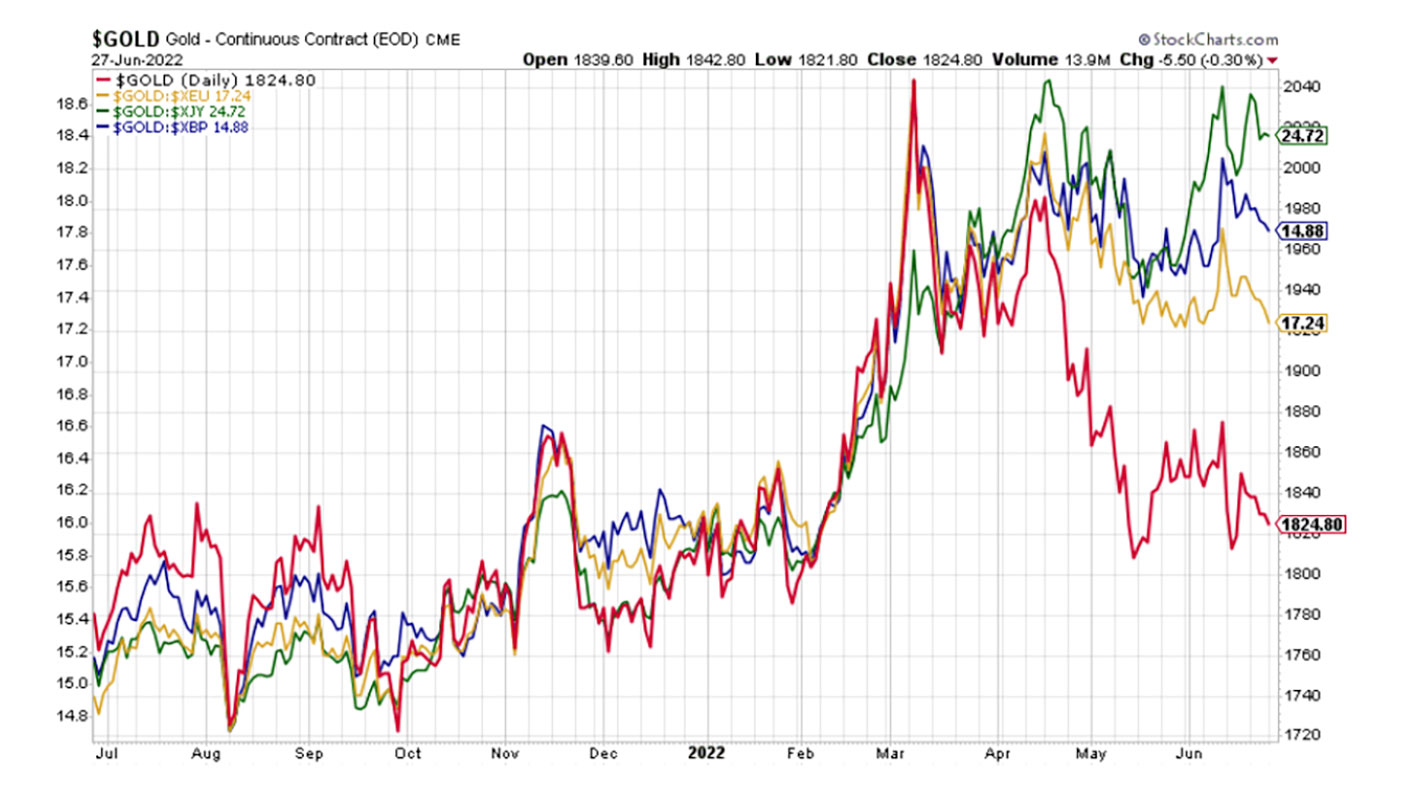
Gold has actually done rather better against other currencies. The chart below shows gold in dollars (red), but also gold measured in pounds (blue), Japanese yen (green) and euros (yellow).

You can see that against all those three currencies, gold is not far off its all-time highs.
Here’s another way of looking at the same thing. This is gold against 18 national currencies. It’s down a little against some of them – the US and Canadian dollars, the Chinese yuan, the Brazilian real, the Mexican peso and the Russian rouble (how has the rouble been so strong?!).
But it’s up, significantly in some cases, against others – the Argentinian peso, the Swiss franc, the euro, the pound, the Korean won, the Japanese yen and, of course, the Turkish lira.
Gold percentage growth for 2021

Gold’s price is being determined then by the much bigger market that is the US dollar, as much as anything. Where’s the US dollar going next? Your guess is as good as mine.
Monetary policy is tighter there than elsewhere, it’s the first port of call for capital in a panic, and so the dollar keeps rising. Currently at 104 on the index, it could go all the way to 120. Unlikely, but it’s been there before.
If it does, gold almost certainly won’t be going anywhere significant.
But of course, if the dollar heads lower – and it will if other countries start to tighten as much as the US – then gold will make a move. I gather analysts at Goldman Sachs have just put a $2,500 year-end target on gold. That would be nice.
Is gold heading for a repeat of the 1970s?
So many comparisons are being made between today and the 1970s. Politically and economically there are parallels galore. The big differences are technological.
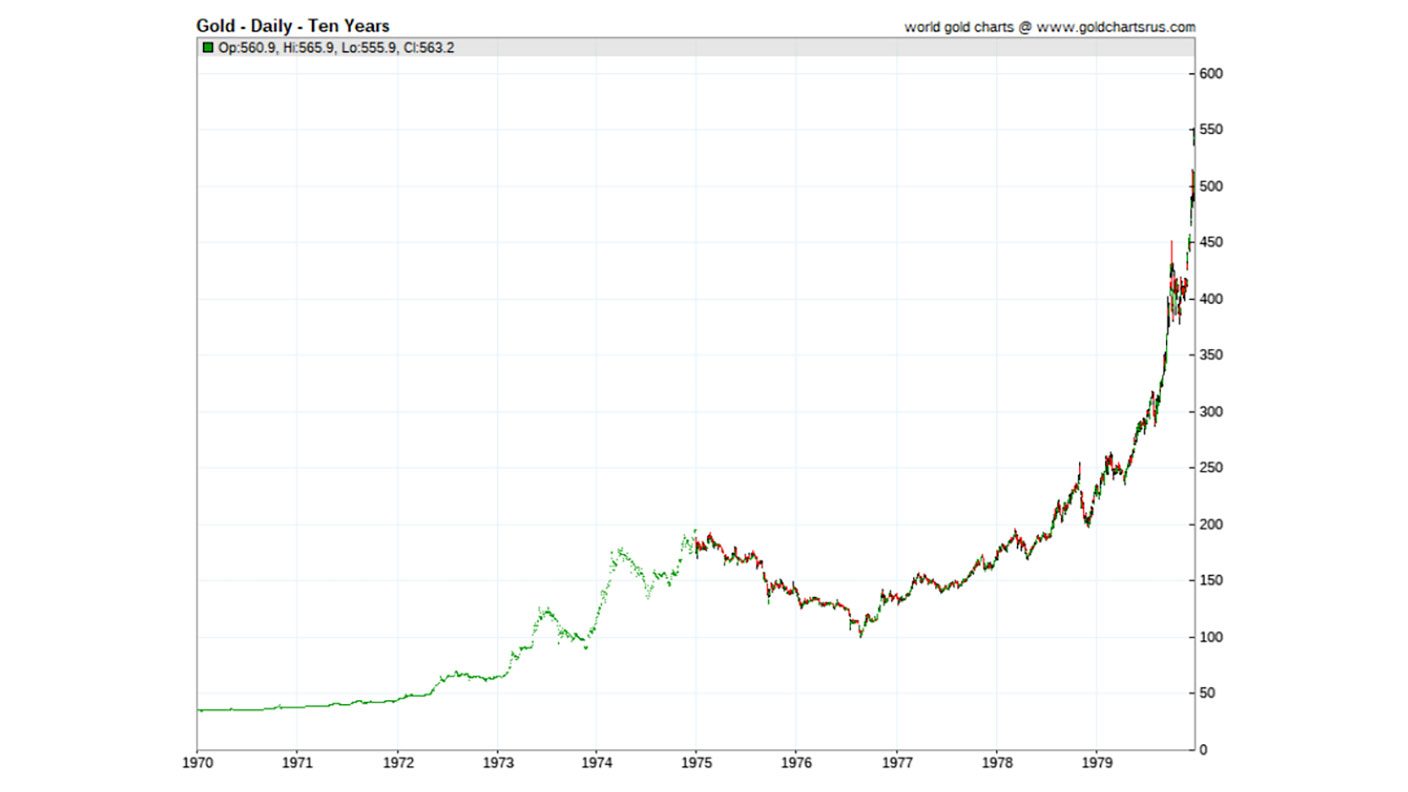
Nevertheless, gold had one of its best ever decades in the 1970s, going from $35/oz in 1971 to $850 (albeit briefly) early in 1980. It was bonanza time for gold mining.
But even within that bonanza decade, gold went through a near two-year bear market in 1975-1976 that saw it fall by nearly half – going from around $200/oz to $100. Imagine if gold went to $1,000 now. That would be hard to swallow.
Here is gold during its glory years.

Longer term, the fundamentals of out-of-control inflation, geopolitical instability, escalating de-globalisation and weak, unpopular leadership all tend to be drivers of flight to gold. But it remains an analogue asset in a world where all the value is digital.
It was me that first made this comparison many years ago, though I still haven’t decided what the answer is. The horse was transport for thousands of years. It was “natural transport”. With the invention of the car it became irrelevant.
Gold, too, was money for thousands of years, “natural money”. But with digital technology and modern communications, is it now as irrelevant to finance and the horse is to transport? Or, like King Arthur to the English, will gold return to finance to save the people in their hour of need?
I guess, until it actually does shows up, we’ll never know the answer
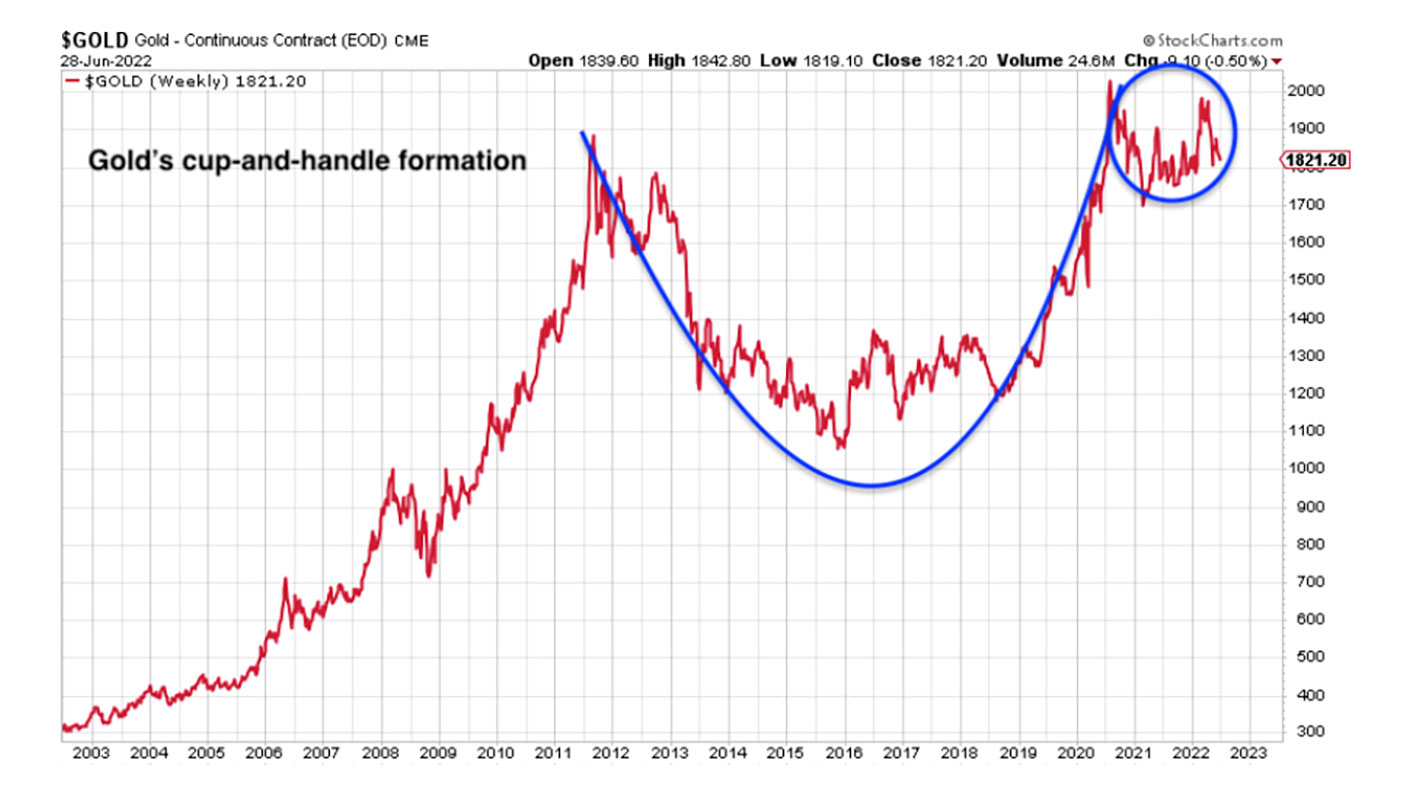
From a technical perspective, that enormous cup-and-handle formation, built up over a decade, remains in play and looks ready to propel gold higher. I’ve illustrated it here.

Cups and handles are another of those commonly observed chart patterns – like “double tops” or “head and shoulders” – which are fairly self-explanatory. This one was first observed in the 1980s. Investopedia calls it a “technical chart pattern that resembles a cup and handle”. It is considered a very bullish signal.
If it plays out, it will give Goldman Sachs their target. And some.
I own gold and I’m glad I do. I may be rude about it, but I love it. And it’s the one part of my portfolio that isn’t keeping me awake at night. In fact, it’s so boring, it’s helping me to sleep.
Dominic will be performing his show, How Heavy?, a lecture with funny bits about the history of weights and measures, at the Edinburgh Fringe this August. You can get tickets here.
Get the latest financial news, insights and expert analysis from our award-winning MoneyWeek team, to help you understand what really matters when it comes to your finances.

-
 Should you buy an active ETF?
ETFs are often mischaracterised as passive products, but they can be a convenient way to add active management to your portfolio
-
 Power up your pension before 5 April – easy ways to save before the tax year end
With the end of the tax year looming, pension savers currently have a window to review and maximise what’s going into their retirement funds – we look at how
-
 Halifax: House price slump continues as prices slide for the sixth consecutive month
UK house prices fell again in September as buyers returned, but the slowdown was not as fast as anticipated, latest Halifax data shows. Where are house prices falling the most?
-
 Rents hit a record high - but is the opportunity for buy-to-let investors still strong?
UK rent prices have hit a record high with the average hitting over £1,200 a month says Rightmove. Are there still opportunities in buy-to-let?
-
 Pension savers turn to gold investments
Investors are racing to buy gold to protect their pensions from a stock market correction and high inflation, experts say
-
 Where to find the best returns from student accommodation
Student accommodation can be a lucrative investment if you know where to look.
-
 The world’s best bargain stocks
Searching for bargain stocks with Alec Cutler of the Orbis Global Balanced Fund, who tells Andrew Van Sickle which sectors are being overlooked.
-
 Revealed: the cheapest cities to own a home in Britain
New research reveals the cheapest cities to own a home, taking account of mortgage payments, utility bills and council tax
-
 UK recession: How to protect your portfolio
As the UK recession is confirmed, we look at ways to protect your wealth.
-
 Buy-to-let returns fall 59% amid higher mortgage rates
Buy-to-let returns are slumping as the cost of borrowing spirals.