Get the latest financial news, insights and expert analysis from our award-winning MoneyWeek team, to help you understand what really matters when it comes to your finances.
You are now subscribed
Your newsletter sign-up was successful
Want to add more newsletters?

Twice daily
MoneyWeek
Get the latest financial news, insights and expert analysis from our award-winning MoneyWeek team, to help you understand what really matters when it comes to your finances.

Four times a week
Look After My Bills
Sign up to our free money-saving newsletter, filled with the latest news and expert advice to help you find the best tips and deals for managing your bills. Start saving today!
Welcome back.
On the cover of this week’s magazine we’ve got Boris Johnson in the dark feeding the electricity meter. With the wind refusing to blow, cross-channel electricity cables exploding and gas prices going through the roof, we could be in for a very tough winter. Simon Wilson looks at what’s going on and weighs up the possibility of the lights going off this winter.
Elsewhere, Dr Mike Tubbs looks at the university spin-out companies involved in cutting edge science and picks the best ways to invest in them. And in our other big feature this week, John Chambers outlines how to cash in on the “beautiful game”. You might think football is just for the oligarchs, but football clubs are also huge global brands. He looks at how you can get in on the action. If you’re not already a subscriber, sign up here and get your first six issues free.
MoneyWeek
Subscribe to MoneyWeek today and get your first six magazine issues absolutely FREE

Sign up to Money Morning
Don't miss the latest investment and personal finances news, market analysis, plus money-saving tips with our free twice-daily newsletter
Don't miss the latest investment and personal finances news, market analysis, plus money-saving tips with our free twice-daily newsletter
This week’s “Too Embarrassed To Ask” video explains what a “contagion” is. It’s a term we’re all probably familiar with in its epidemiological sense these days, but what does it mean in terms of financial markets? Find out exactly what it means here.
And in this week’s podcast, Merryn’s joined by Rob Arnott of Research Affiliates. They talk about some of the unexpected consequences of Covid and the opportunities for investors, plus the “wonderful safe haven” of UK value stocks, and the attractions of energy companies. Listen to the episode here.
Here are the links for this week’s editions of Money Morning and other web articles you may have missed:
- Monday Money Morning: China’s property woes are coming to a head – so what happens now?
- Web article: What you should do if your energy provider goes bust
- Tuesday Money Morning: What to invest in to beat soaring energy prices
- Merryn’s blog: The end of the bond bull market, and how to invest for it
- Web article: How high energy prices are driving up food prices too
- Wednesday Money Morning: The uranium price is soaring – here’s the best way to play it now
- Web article: Why is the UK short of CO2 and what does it mean for you?
- Thursday Money Morning: The US Federal Reserve is about to rein in its money-printing – what does that mean for markets?
- Friday Money Morning: China Evergrande just missed a bond payment. Does it matter?
- Web article: How to cut your energy bill this winter
- Cryptocurrency roundup: Cryptocurrency roundup: China’s crackdown intensifies
Now for the charts of the week.
The charts that matter
Gold attempted a rally early on in the week, but ended on a depressed note, partly because the Federal Reserve was more hawkish than expected (ie monetary tightening could be coming sooner than investors had hoped).
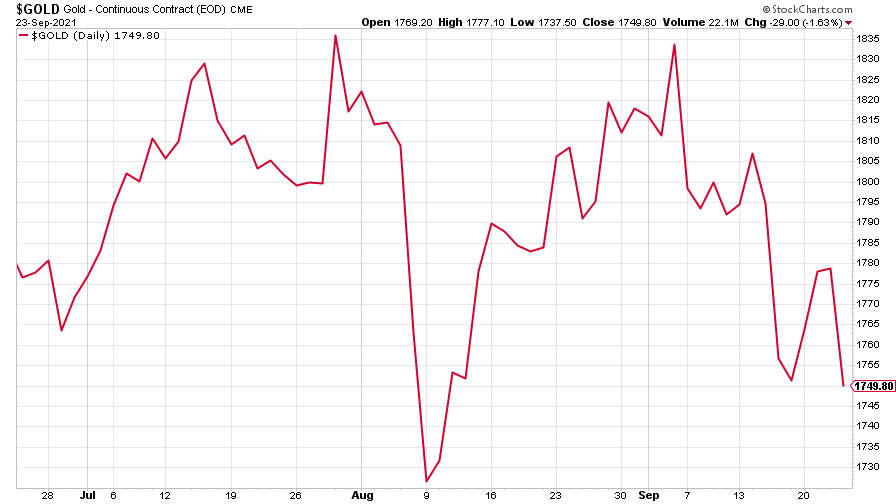
(Gold: three months)
That said, the US dollar index (DXY – a measure of the strength of the dollar against a basket of the currencies of its major trading partners) slipped, which isn’t necessarily what you’d expect in the context – although it might be partly because other global central banks look set to tighten still faster than the Fed.
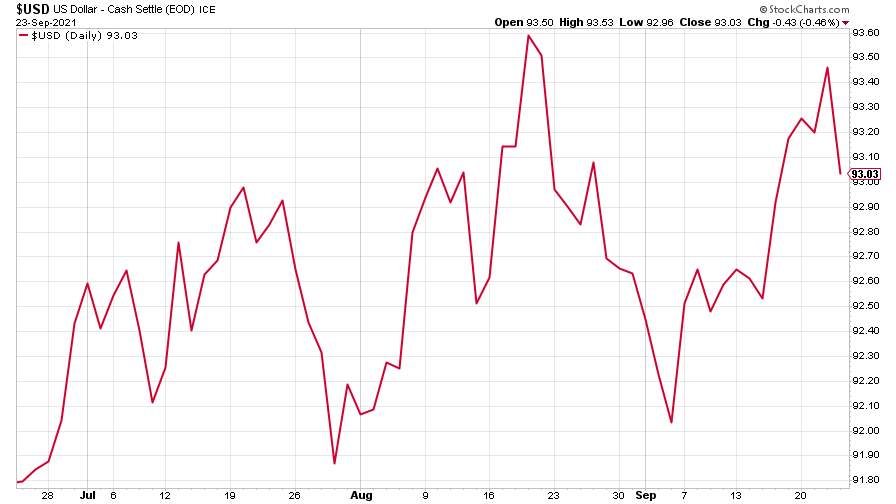
(DXY: three months)
The Chinese yuan (or renminbi) continued to tread water (when the red line is rising, the dollar is strengthening while the yuan is weakening).
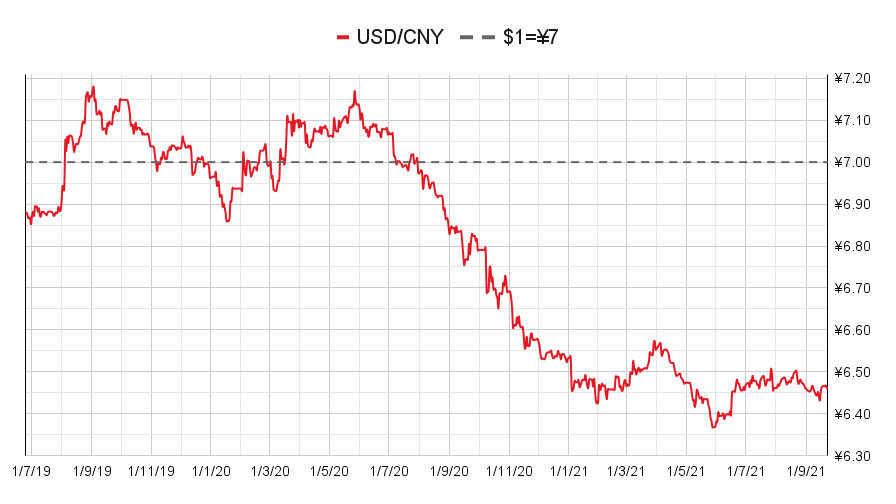
(Chinese yuan to the US dollar: since 25 Jun 2019)
The yield on the ten-year US government bond perked up at the idea of interest rates rising.
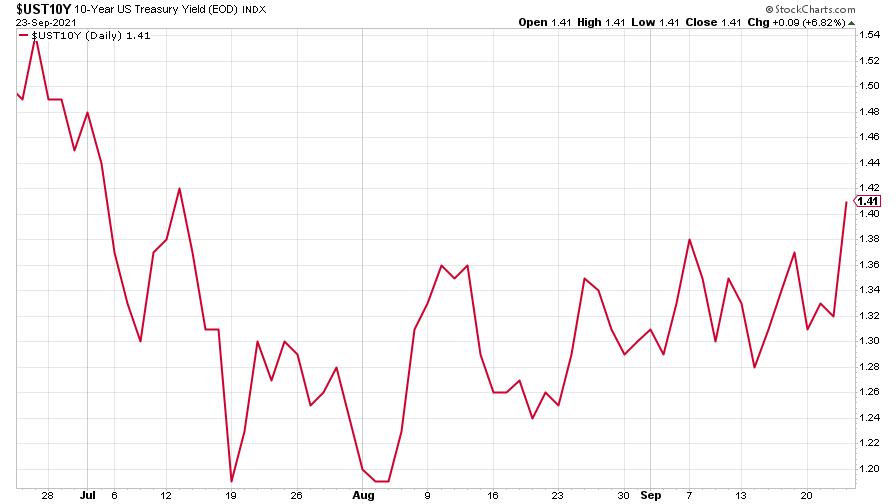
(Ten-year US Treasury yield: three months)
The yield on the Japanese ten-year bond fell back, however.
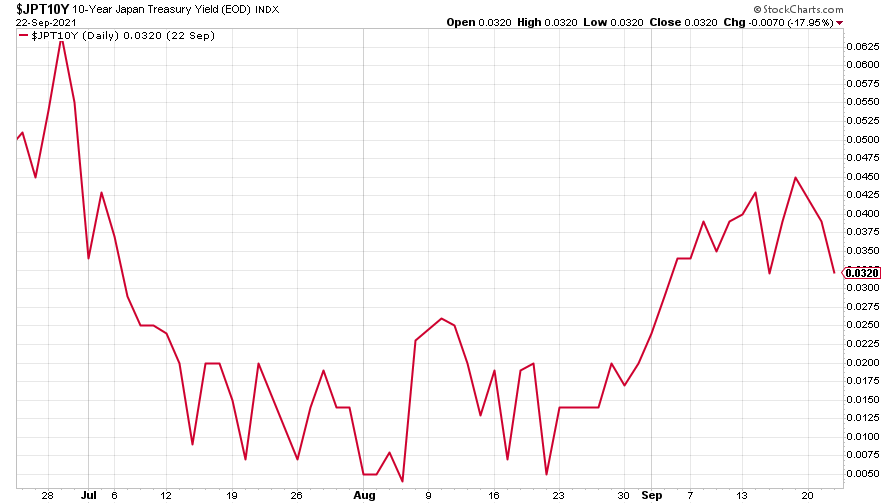
(Ten-year Japanese government bond yield: three months)
And the yield on the ten-year German Bund continued its gradual rise.
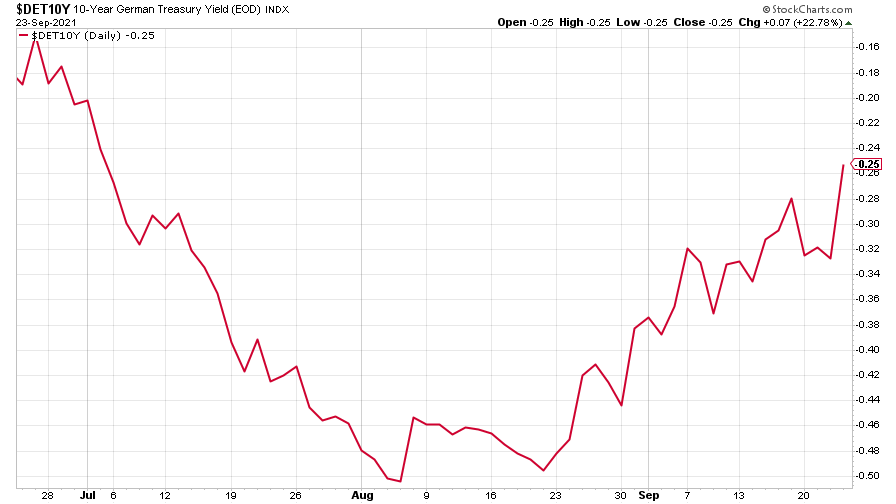
(Ten-year Bund yield: three months)
Copper continued to trade sideways, rattled by China’s economic and financial system woes, of which Evergrande is the most obvious symptom.
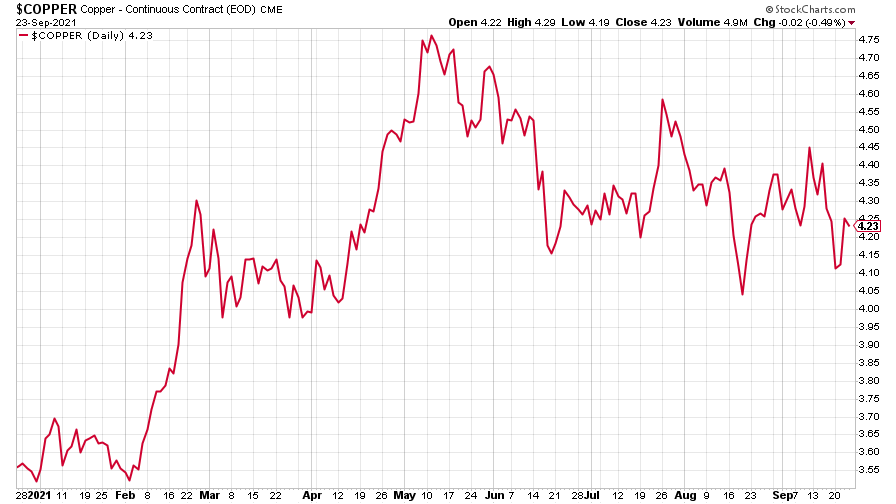
(Copper: nine months)
The closely-related Aussie dollar edged up a little.
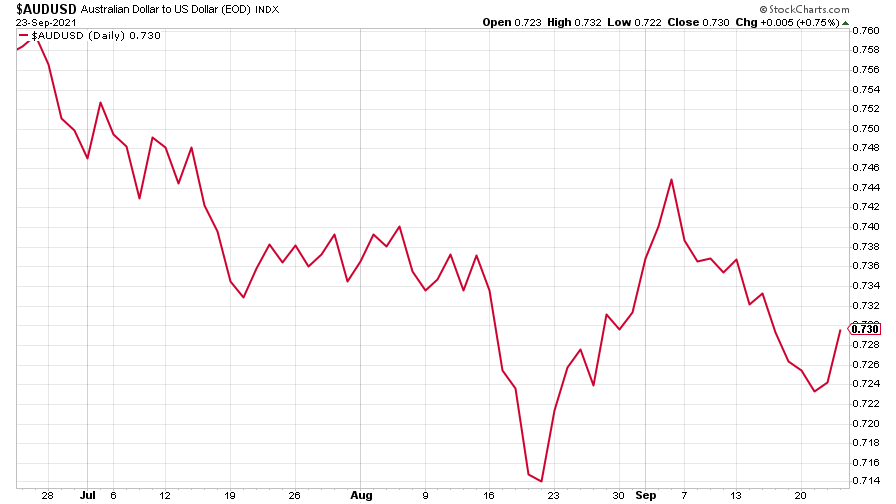
(Aussie dollar vs US dollar exchange rate: three months)
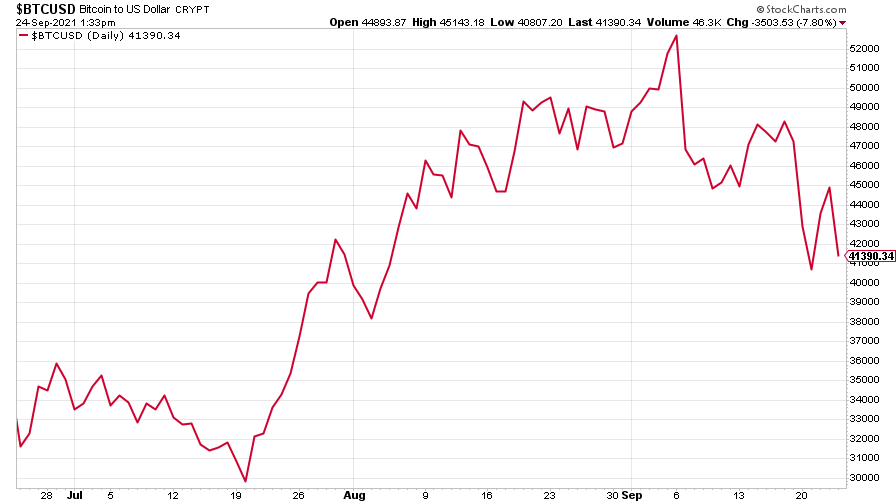
Bitcoin had a miserable end to the week after China basically banned cryptocurrency transactions (although it’s hardly the first time China has demonstrated hostility to cryptocurrencies).
(Bitcoin: three months)
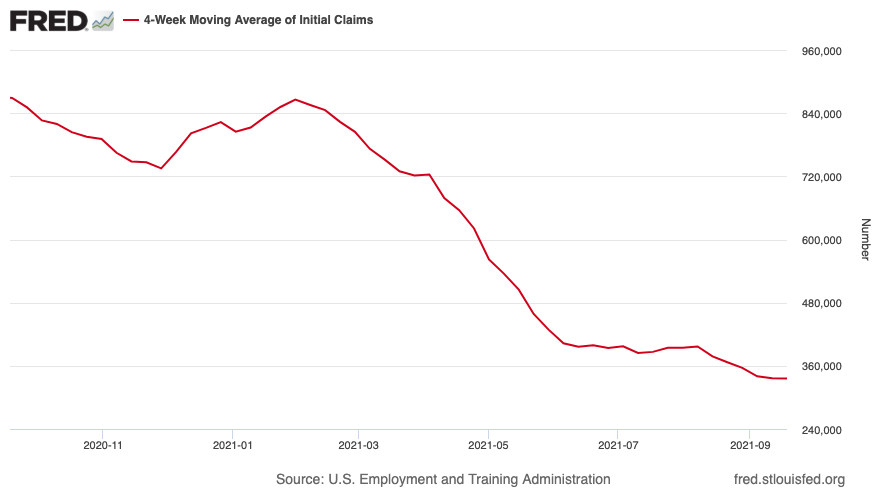
US weekly initial jobless claims rose by 16,000 to 351,000. The four-week moving average fell by 750 to 335,750.
(US initial jobless claims, four-week moving average: since Jan 2020)
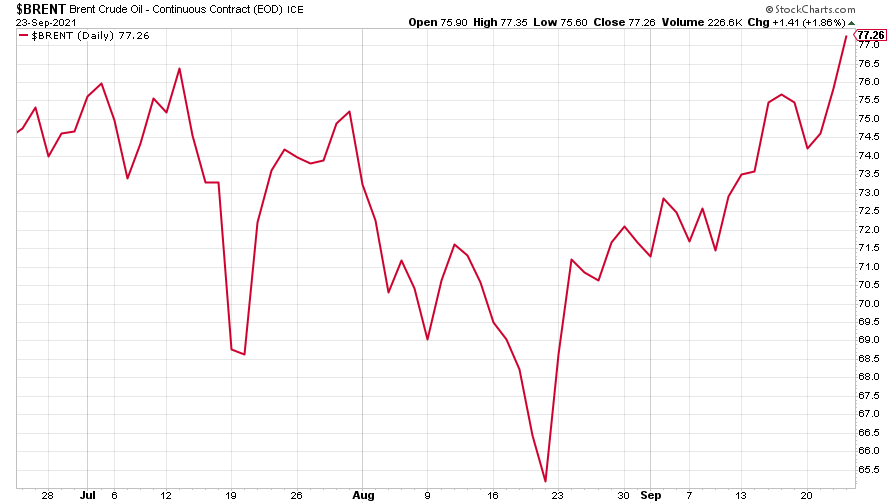
The oil price rose to more than $77 a barrel as spiking energy prices hit the headlines.
(Brent crude oil: three months)
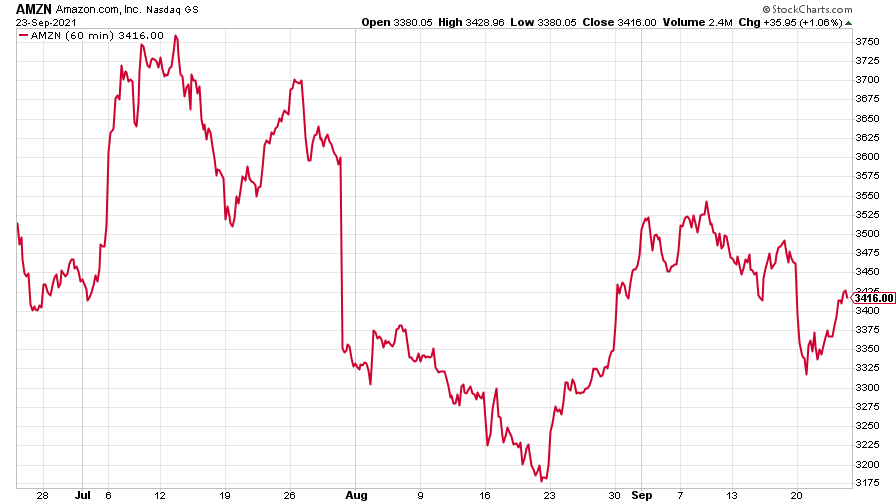
Amazon recovered some of its recent losses.
(Amazon: three months)
Tesla had a remarkably similar week.
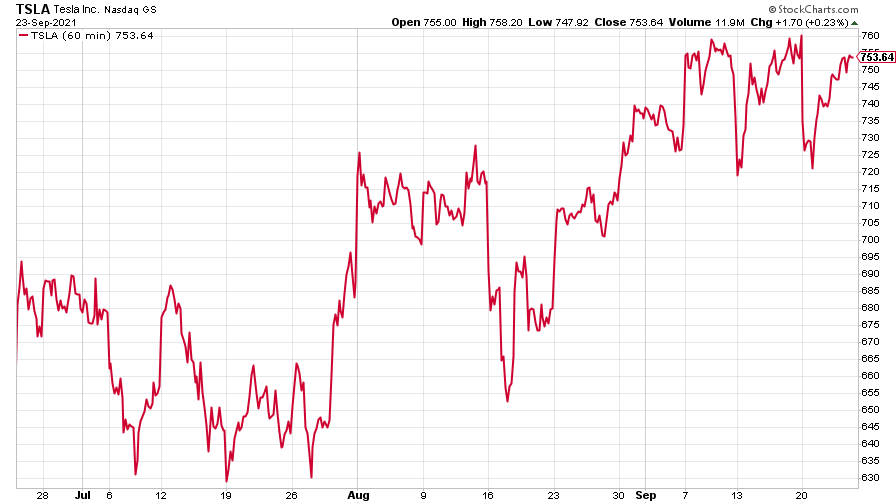
(Tesla: three months)
Have a great weekend.
Get the latest financial news, insights and expert analysis from our award-winning MoneyWeek team, to help you understand what really matters when it comes to your finances.

-
 MoneyWeek Talks: The funds to choose in 2026
Podcast Fidelity's Tom Stevenson reveals his top three funds for 2026 for your ISA or self-invested personal pension
-
 Three companies with deep economic moats to buy now
Opinion An economic moat can underpin a company's future returns. Here, Imran Sattar, portfolio manager at Edinburgh Investment Trust, selects three stocks to buy now
-
 'Investors should brace for Trump’s great inflation'
Opinion Donald Trump's actions against Federal Reserve chair Jerome Powell will likely stoke rising prices. Investors should prepare for the worst, says Matthew Lynn
-
 'Governments are launching an assault on the independence of central banks'
Opinion Say goodbye to the era of central bank orthodoxy and hello to the new era of central bank dependency, says Jeremy McKeown
-
 Do we need central banks, or is it time to privatise money?
Analysis Free banking is one alternative to central banks, but would switching to a radical new system be worth the risk?
-
 Will turmoil in the Middle East trigger inflation?
The risk of an escalating Middle East crisis continues to rise. Markets appear to be dismissing the prospect. Here's how investors can protect themselves.
-
 Federal Reserve cuts US interest rates for the first time in more than four years
Policymakers at the US central bank also suggested rates would be cut further before the year is out
-
 The Bank of England can’t afford to hike interest rates again
With inflation falling, the cost of borrowing rising and the economy heading into an election year, the Bank of England can’t afford to increase interest rates again.
-
 Interest rates held at 5.25% again
The Bank of England has kept rates at 5.25% again, in a widely anticipated move. We look at what it means for your money - and what the Bank’s next move could be
-
 US inflation rises to 3.7% as energy prices surge - will the Fed hike rates?
US consumer price index rose in August but markets do not expect a rate hike this month
