Get the latest financial news, insights and expert analysis from our award-winning MoneyWeek team, to help you understand what really matters when it comes to your finances.
You are now subscribed
Your newsletter sign-up was successful
Want to add more newsletters?

Twice daily
MoneyWeek
Get the latest financial news, insights and expert analysis from our award-winning MoneyWeek team, to help you understand what really matters when it comes to your finances.

Four times a week
Look After My Bills
Sign up to our free money-saving newsletter, filled with the latest news and expert advice to help you find the best tips and deals for managing your bills. Start saving today!
Welcome back.
This week’s magazine looks at the “new space age”, in light of Richard Branson winning the “battle of the billionaires” to be first in space. We also have an in-depth look at the fight against neurodegenerative diseases, such as Alzheimer’s and Parkinson’s. There’s a lot going on in the field, and big profits for the company that can develop an effective drug. Mike Tubbs looks at the latest news, and picks some of the best stocks to buy.
This week’s “Too Embarrassed To Ask” video explains what the rather clunky acronym “Ebitda” means. You can watch that here.
MoneyWeek
Subscribe to MoneyWeek today and get your first six magazine issues absolutely FREE

Sign up to Money Morning
Don't miss the latest investment and personal finances news, market analysis, plus money-saving tips with our free twice-daily newsletter
Don't miss the latest investment and personal finances news, market analysis, plus money-saving tips with our free twice-daily newsletter
Once again, Merryn’s got a star guest for this week’s podcast. Author and economic historian Russell Napier talks to Merryn about the Asian financial crisis (the subject of his excellent new book, which you can get at 20% off with the code in the podcast); financial repression – or, as he calls it, “stealing money from old people slowly” – and why you should buy property, though perhaps not where you might expect. Find out what he has to say here.
Here are the links for this week’s editions of Money Morning and other web articles you may have missed:
- Monday Money Morning: Why is China easing monetary policy?
- Web article: Is Covid’s Delta variant putting pressure on Europe’s economic recovery?
- Tuesday Money Morning: Demand for equities is high right now – but supply is rising to meet it
- Merryn’s blog: Why equities are better investments than art
- Web article: US inflation spiked in June. Can this really still be transitory?
- Wednesday Money Morning: If you bought gold with pounds, it’s been a disappointing year – but be patient
Web article: UK inflation hits three-year high as economy opens up - Thursday Money Morning: It might be time for the reflation trade to spark back into life
- Web article: UK employment figures and wages up as recovery gains speed
- Friday Money Morning: The Bank of Japan is getting into industrial policy
- Cryptocurrency roundup: Twitter founder’s “DeFi” platform
Now for the charts of the week.
The charts that matter
Gold’s recovery continued - could this be the start of another one of runs? Patience is key for gold investors, says Dominic.
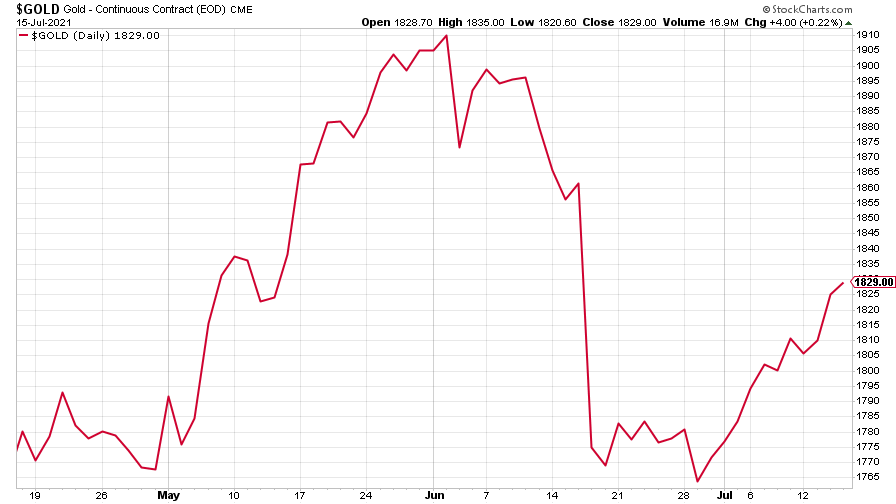
(Gold: three months)
The US dollar index (DXY – a measure of the strength of the dollar against a basket of the currencies of its major trading partners) carried on getting stronger.
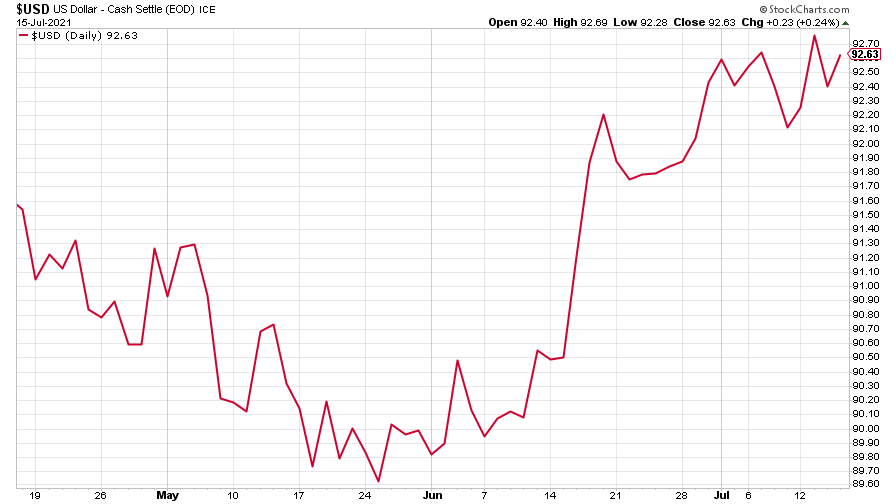
(DXY: three months)
The Chinese yuan (or renminbi) continued to reflect the dollar’s strength (when the red line is rising, the dollar is strengthening while the yuan is weakening).
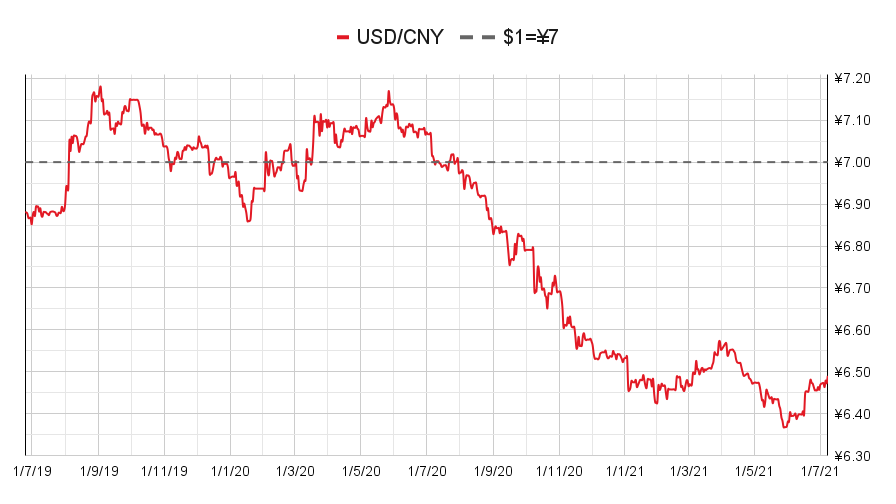
(Chinese yuan to the US dollar: since 25 Jun 2019)
The yield on the ten-year US government bond attempted to climb back up but gave up most of its gains by the end of the week.
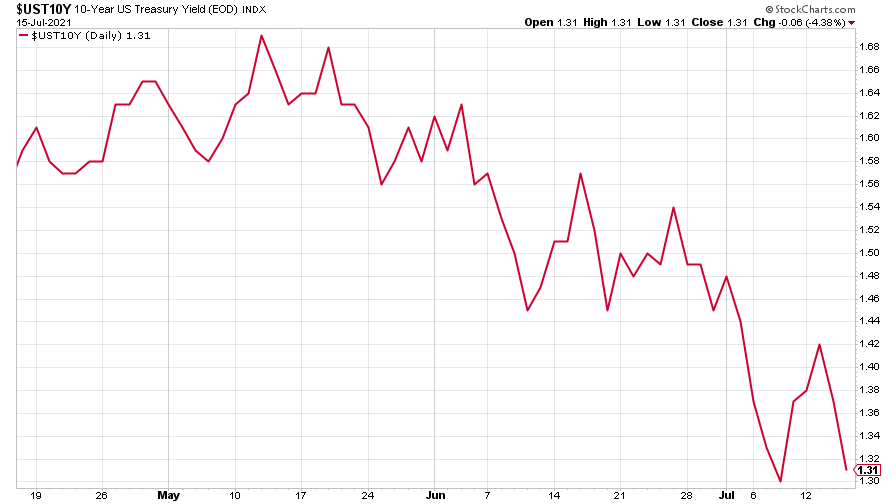
(Ten-year US Treasury yield: three months)
The yield on the Japanese ten-year bond fell further, with a reprieve towards the end of the week.
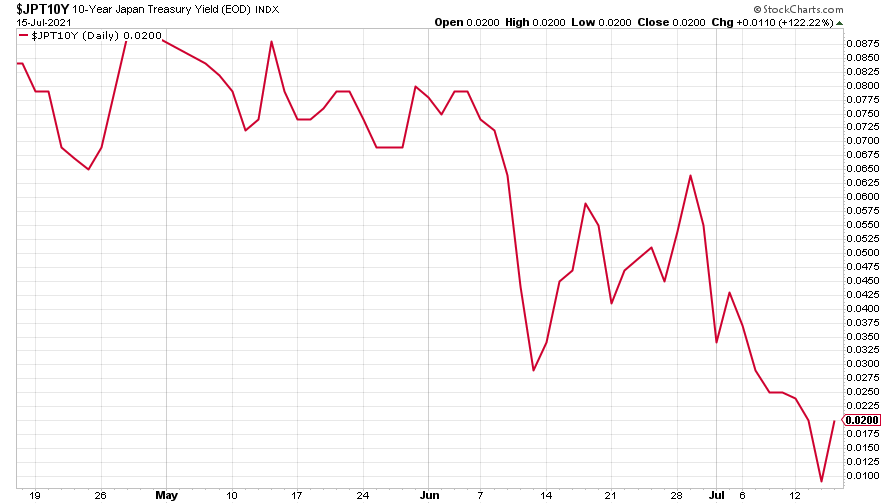
(Ten-year Japanese government bond yield: three months)
And the yield on the ten-year German Bund fell further, too.
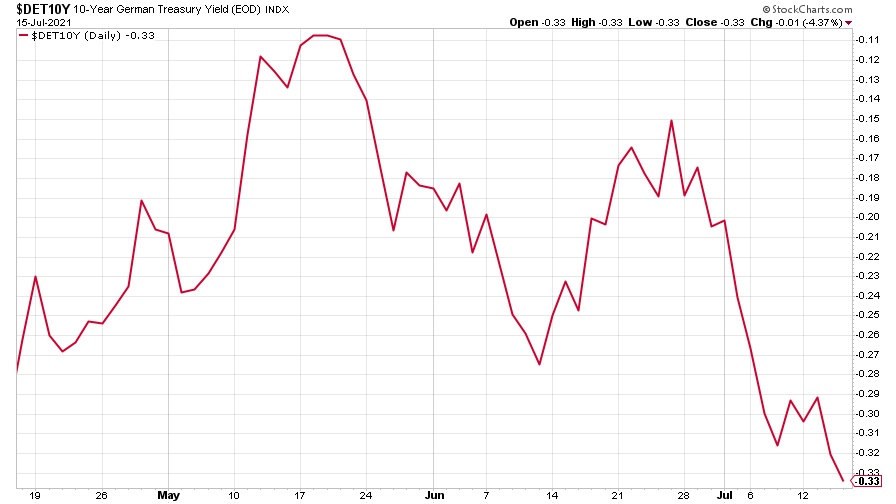
(Ten-year Bund yield: three months)
Copper looks to be turning up again – it might be time for the reflation trade to spark back into life, said John earlier this week.
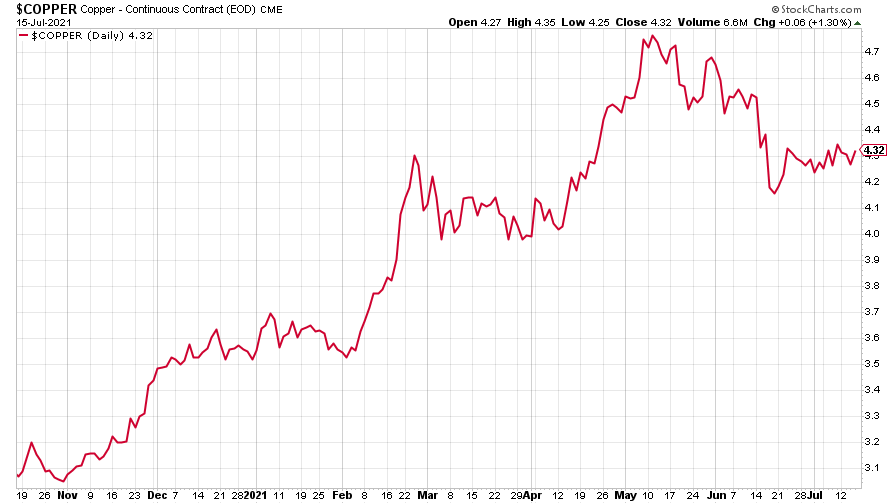
(Copper: nine months)
The closely-related Aussie dollar continued to fall, however.
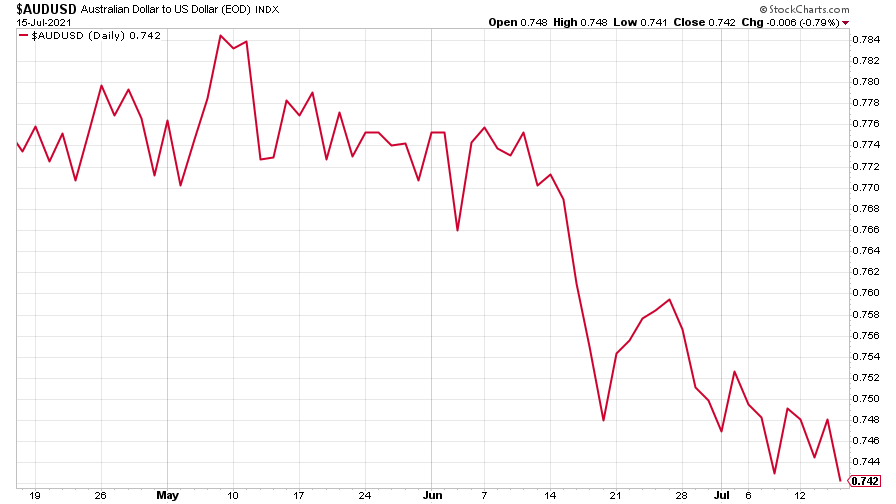
(Aussie dollar vs US dollar exchange rate: three months)
Bitcoin continued its drift lower.
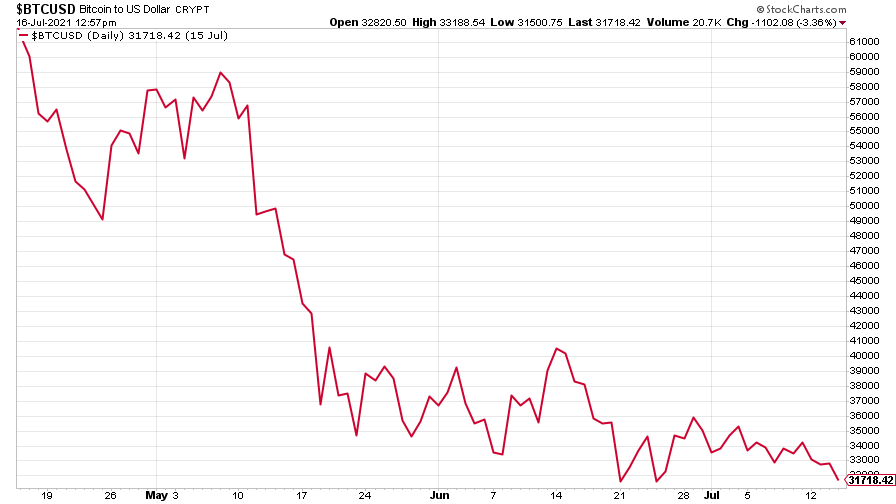
(Bitcoin: three months)
US weekly initial jobless claims fell by 26,000 to 360,000. The four-week moving average fell by 14,500 to 382,500.
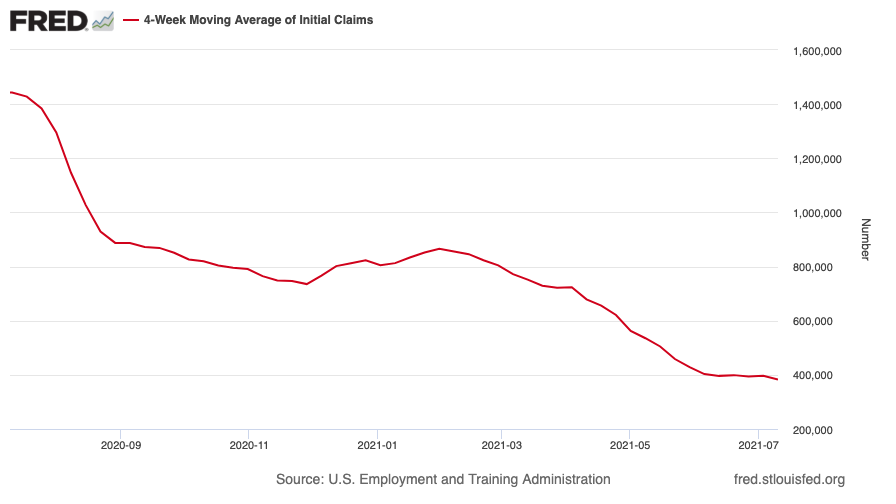
(US initial jobless claims, four-week moving average: since Jan 2020)
The oil price saw a big drop towards the end of the week.
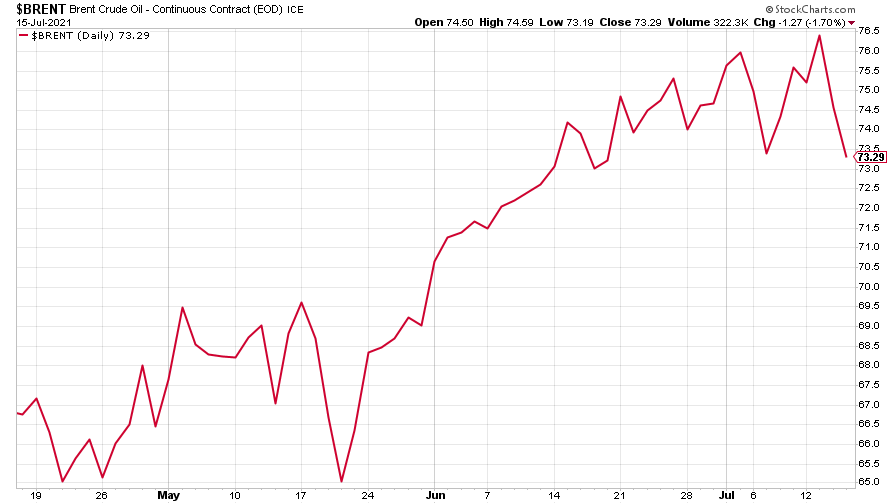
(Brent crude oil: three months)
Amazon fell, too.
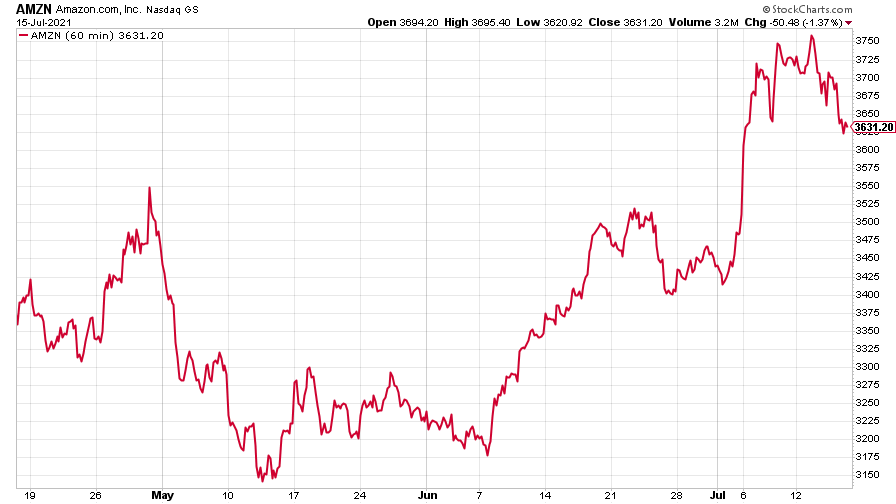
(Amazon: three months)
And Tesla slid back after some earlier gains.
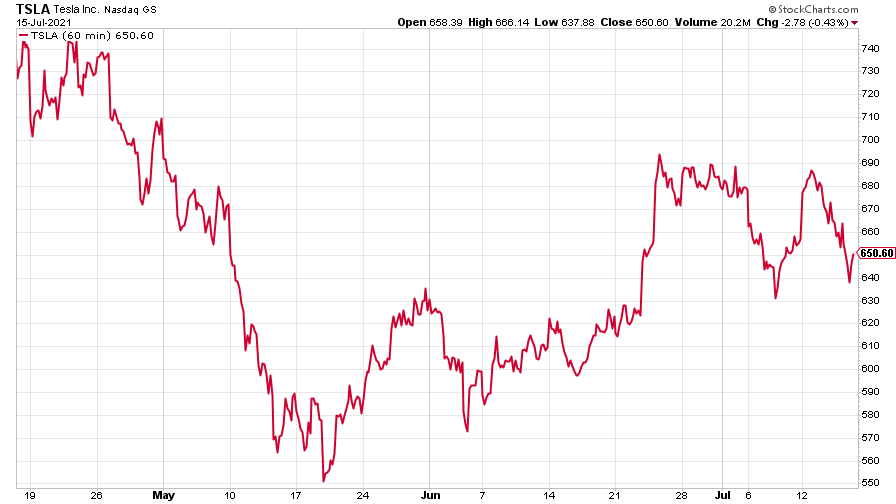
(Tesla: three months)
Have a great weekend.
Get the latest financial news, insights and expert analysis from our award-winning MoneyWeek team, to help you understand what really matters when it comes to your finances.

-
 The most single-friendly areas to buy a property
There can be a single premium when it comes to getting on the property ladder but Zoopla has identified parts of the UK that remain affordable if you aren’t coupled-up
-
 RICS: UK housing market showing signs of 'tentative recovery'
RICS members are becoming less negative about property sales and house prices. What does the latest data mean for the property market?
-
 UK wages grow at a record pace
The latest UK wages data will add pressure on the BoE to push interest rates even higher.
-
 Trapped in a time of zombie government
It’s not just companies that are eking out an existence, says Max King. The state is in the twilight zone too.
-
 America is in deep denial over debt
The downgrade in America’s credit rating was much criticised by the US government, says Alex Rankine. But was it a long time coming?
-
 UK economy avoids stagnation with surprise growth
Gross domestic product increased by 0.2% in the second quarter and by 0.5% in June
-
 Bank of England raises interest rates to 5.25%
The Bank has hiked rates from 5% to 5.25%, marking the 14th increase in a row. We explain what it means for savers and homeowners - and whether more rate rises are on the horizon
-
 UK inflation remains at 8.7% ‒ what it means for your money
Inflation was unmoved at 8.7% in the 12 months to May. What does this ‘sticky’ rate of inflation mean for your money?
-
 Would a food price cap actually work?
Analysis The government is discussing plans to cap the prices of essentials. But could this intervention do more harm than good?
-
 Is my pay keeping up with inflation?
Analysis High inflation means take home pay is being eroded in real terms. An online calculator reveals the pay rise you need to match the rising cost of living - and how much worse off you are without it.
