Get the latest financial news, insights and expert analysis from our award-winning MoneyWeek team, to help you understand what really matters when it comes to your finances.
You are now subscribed
Your newsletter sign-up was successful
Want to add more newsletters?

Twice daily
MoneyWeek
Get the latest financial news, insights and expert analysis from our award-winning MoneyWeek team, to help you understand what really matters when it comes to your finances.

Four times a week
Look After My Bills
Sign up to our free money-saving newsletter, filled with the latest news and expert advice to help you find the best tips and deals for managing your bills. Start saving today!
Welcome back.
In this week’s magazine, we’re taking a look at cronyism, sleaze, or, if you prefer, good old fashioned corruption. In our main feature, Stuart Watkins asks if we’re living in a “new era of sleaze”, and argues that not only does it destroy confidence in our government and institutions, but it destroys wealth as well. Elsewhere, on a more positive note, Max King looks at the best ways to invest in micro-cap stocks, and David Stevenson investigates the fast-growing world of equity crowdfunding.
In the podcast this week, Merryn talks to Tom Slater from one of MoneyWeek's favourite investment rusts, Scottish Mortgage. Tom is a big fan of growth stocks, and sees no reason to stop buying them. Because we know so many of you hold this trust, it's a longer than usual epsiode – and it's fascinating. Listen to what Tom has to say here.
MoneyWeek
Subscribe to MoneyWeek today and get your first six magazine issues absolutely FREE

Sign up to Money Morning
Don't miss the latest investment and personal finances news, market analysis, plus money-saving tips with our free twice-daily newsletter
Don't miss the latest investment and personal finances news, market analysis, plus money-saving tips with our free twice-daily newsletter
This week’s “Too Embarrassed To Ask” video takes a look at Ponzi schemes, perhaps the best-known of the many financial scams people seem to get into, and explains what they are and how they work. Watch that here.
Here are the links for this week’s editions of Money Morning and other web stories you may have missed.
- Monday Money Morning: What is “Britcoin” and what could it mean for you?
- Web article: Can accident-prone Credit Suisse ever turn the corner?
- Tuesday Money Morning: What do investment trust directors do?
- Web article: The Greensill saga: what’s it about and what does it mean for you?
- Wednesday Money Morning: Does the old investment adage to “sell in May” still hold true?
- Thursday Money Morning: Central bank digital currencies are coming, whether you like it or not
- Friday Money Morning: Inheritance tax bills are set to rise – will you be caught out?
- Web article: Frenzied house price boom leaves buyers desperate
Now for the charts of the week.
The charts that matter
Gold’s mini-rally dropped off a little.
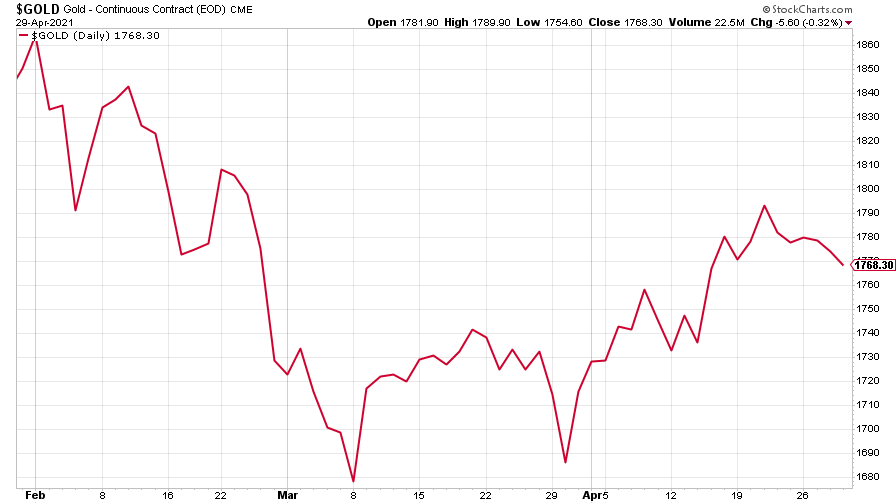
(Gold: three months)
The US dollar index (DXY – a measure of the strength of the dollar against a basket of the currencies of its major trading partners) continued to slide.
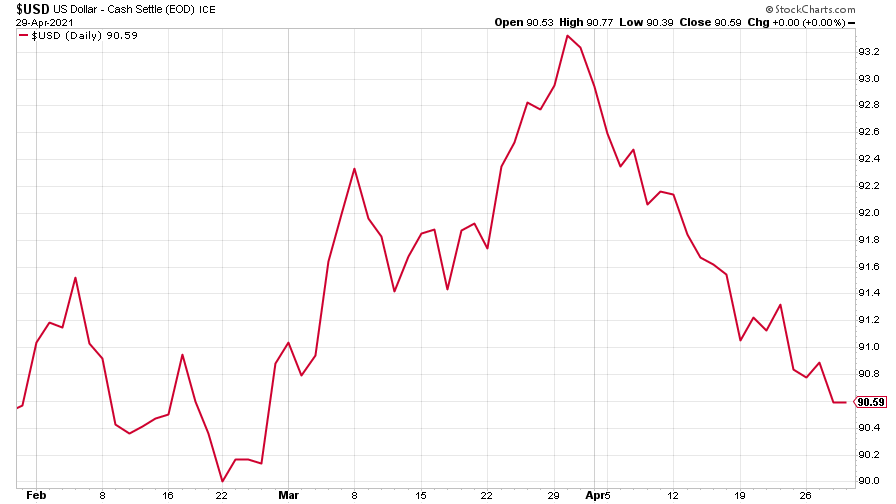
(DXY: three months)
The Chinese yuan (or renminbi) looked to be weakening against the dollar recently, but has strengthened in the last week or two (when the red line is rising, the dollar is strengthening while the yuan is weakening).
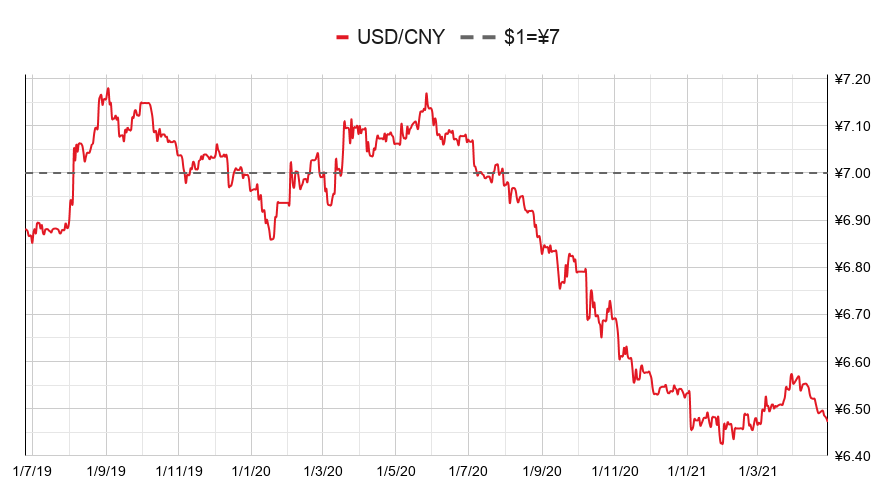
(Chinese yuan to the US dollar: since 25 Jun 2019)
The downward drift in the yield on the ten-year US government bond halted, as yields turned back up.
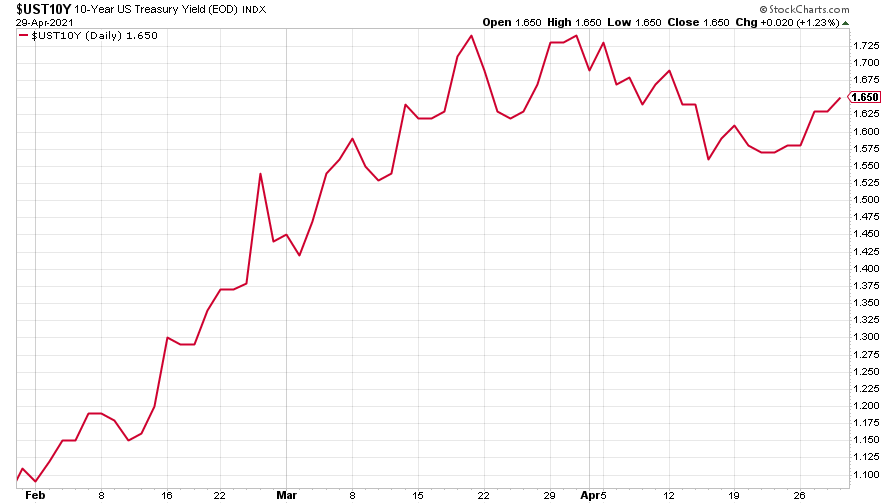
(Ten-year US Treasury yield: three months)
The yield on the Japanese ten-year bond also arrested its decline.
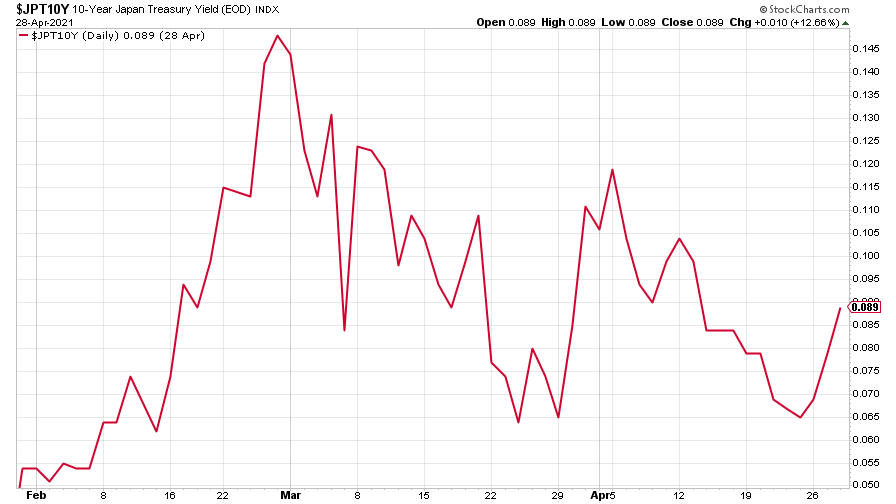
(Ten-year Japanese government bond yield: three months)
The yield on the ten-year German Bund, continued its seemingly unstoppable rise towards positive territory.
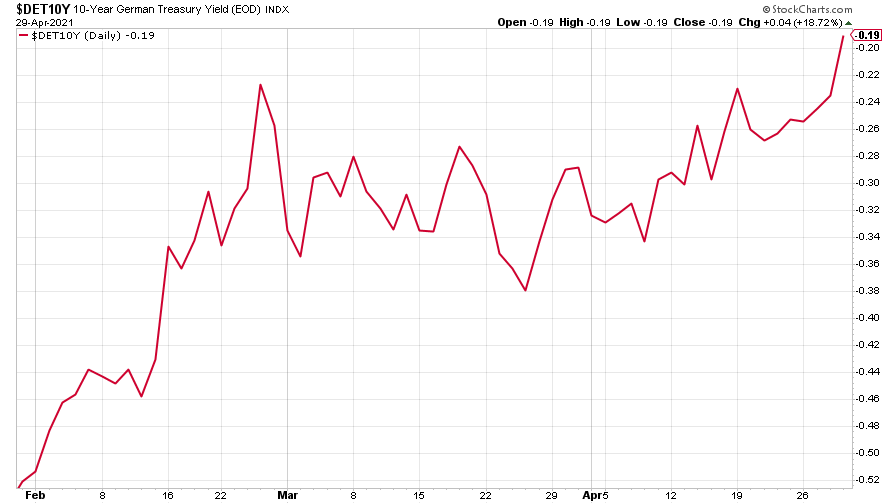
(Ten-year Bund yield: three months)
Copper’s raging bull market continued. It’s up by 26% so far this year and is up to its highest level since 2011.
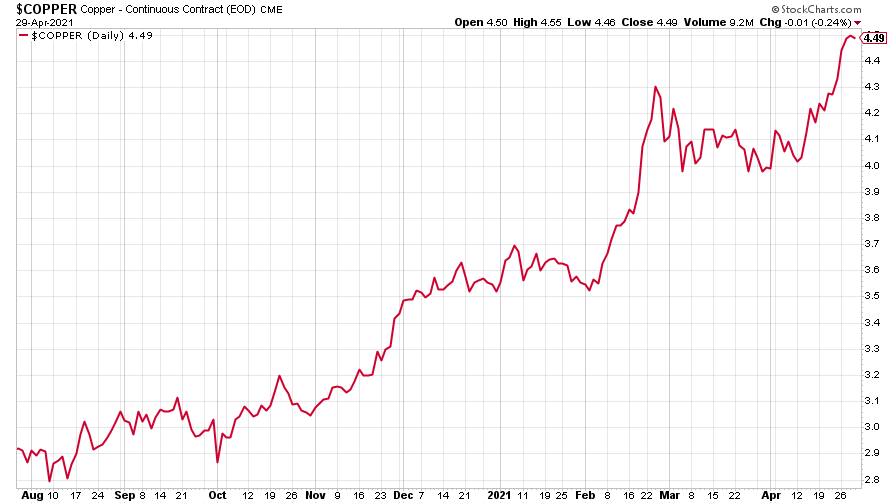
(Copper: nine months)
The closely-related Aussie dollar is wobbling higher along with copper.
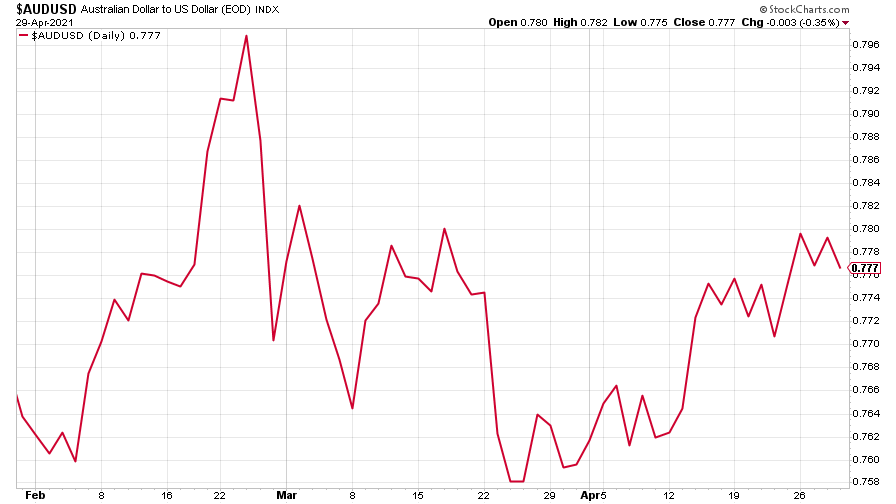
(Aussie dollar vs US dollar exchange rate: three months)
Cryptocurrency bitcoin recovered some of its losses, bit its meteoric rise seems to be over – for now.
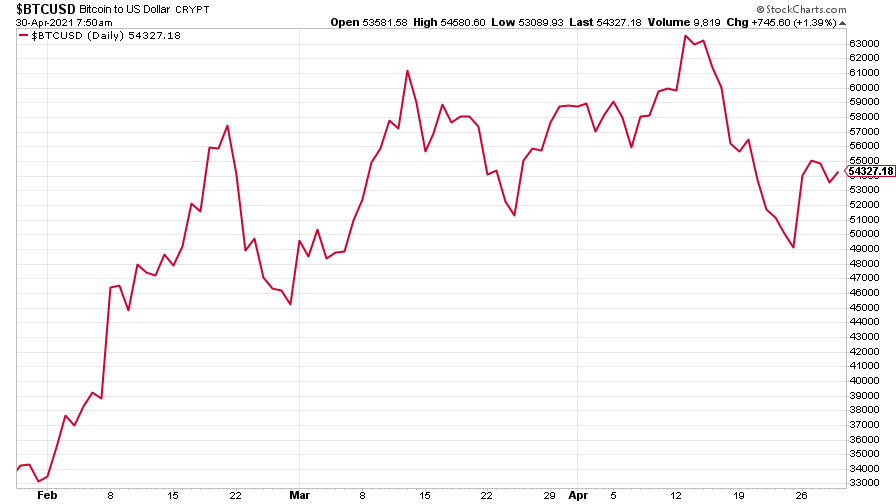
(Bitcoin: three months)
US weekly initial jobless claims continued its downward trend, falling by 13,000 to 553,000, compared to 566,000 last week (revised up from 547,000). The four-week moving average fell to 611,750, down 44,000 from 655,750 (which was revised up from 651,000) the week before. It’s the lowest average number of claims since March 2020, when it was 225,500.
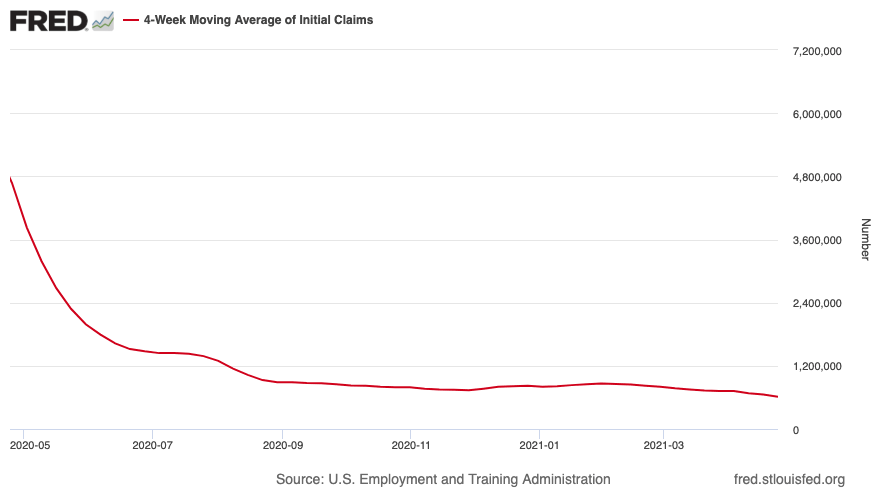
(US initial jobless claims, four-week moving average: since Jan 2020)
The oil price seems to be making its way back up, but faces headwinds as India’s economy slows. India is the world’s third biggest oil market.
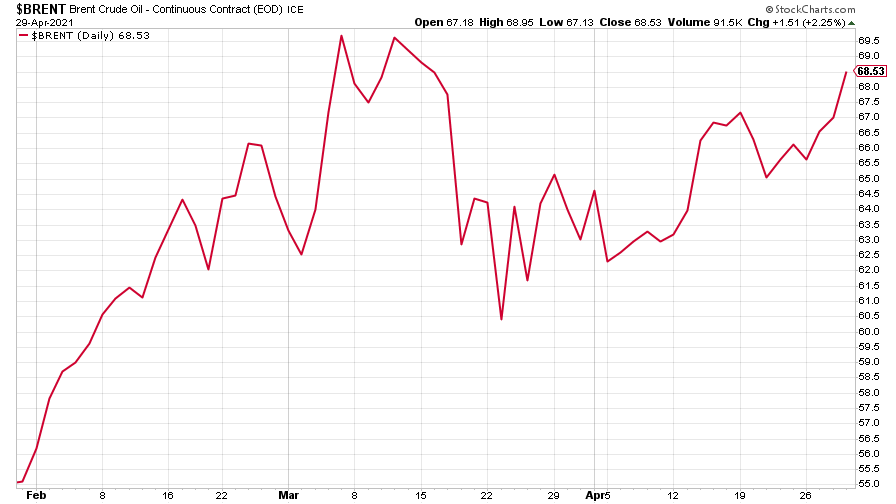
(Brent crude oil: three months)
Amazon headed up – investors’ appetite for growth stocks has clearly not exhausted itself yet.
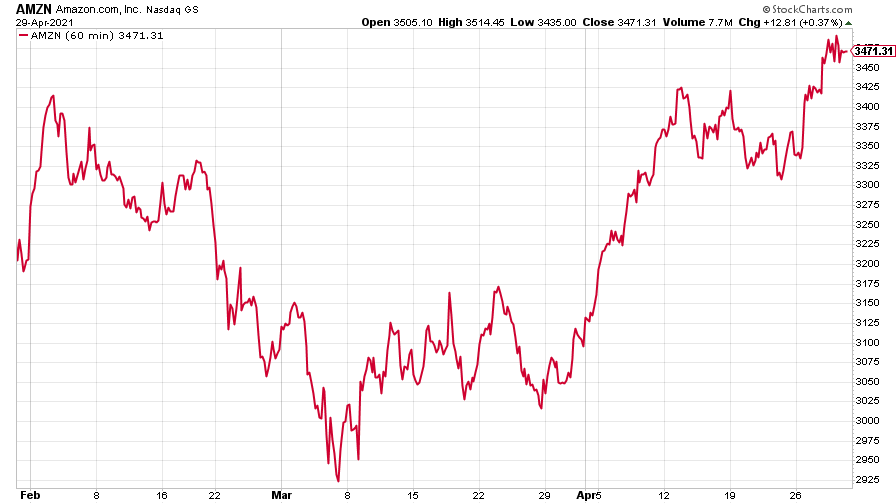
(Amazon: three months)
Tesla, however, slipped down, despite higher profits (though not all from selling electric cars – Tesla made $101m from bitcoin and $518m from “regulatory credits”).
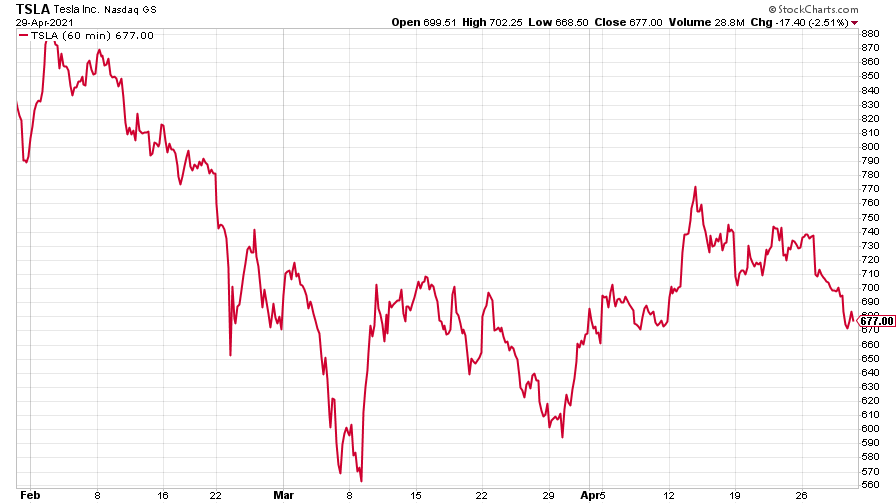
(Tesla: three months)
Have a great weekend.
Ben
Get the latest financial news, insights and expert analysis from our award-winning MoneyWeek team, to help you understand what really matters when it comes to your finances.

-
 RICS: UK housing market showing signs of 'tentative recovery'
RICS members are becoming less negative about property sales and house prices. What does the latest data mean for the property market?
-
 Last chance to invest in VCTs? Here's what you need to know
Investors have pumped millions more into Venture Capital Trusts (VCTS) so far this tax year, but time is running out to take advantage of tax perks from them.
-
 UK wages grow at a record pace
The latest UK wages data will add pressure on the BoE to push interest rates even higher.
-
 Trapped in a time of zombie government
It’s not just companies that are eking out an existence, says Max King. The state is in the twilight zone too.
-
 America is in deep denial over debt
The downgrade in America’s credit rating was much criticised by the US government, says Alex Rankine. But was it a long time coming?
-
 UK economy avoids stagnation with surprise growth
Gross domestic product increased by 0.2% in the second quarter and by 0.5% in June
-
 Bank of England raises interest rates to 5.25%
The Bank has hiked rates from 5% to 5.25%, marking the 14th increase in a row. We explain what it means for savers and homeowners - and whether more rate rises are on the horizon
-
 UK inflation remains at 8.7% ‒ what it means for your money
Inflation was unmoved at 8.7% in the 12 months to May. What does this ‘sticky’ rate of inflation mean for your money?
-
 Would a food price cap actually work?
Analysis The government is discussing plans to cap the prices of essentials. But could this intervention do more harm than good?
-
 Is my pay keeping up with inflation?
Analysis High inflation means take home pay is being eroded in real terms. An online calculator reveals the pay rise you need to match the rising cost of living - and how much worse off you are without it.
