The charts that matter: Tesla buys bitcoin and commodities surge
In a week when Elon Musk piled into bitcoin in a big way and commodities continued their rise, John Stepek looks at how that affects the charts that matter most to the global economy.

Get the latest financial news, insights and expert analysis from our award-winning MoneyWeek team, to help you understand what really matters when it comes to your finances.
You are now subscribed
Your newsletter sign-up was successful
Want to add more newsletters?

Twice daily
MoneyWeek
Get the latest financial news, insights and expert analysis from our award-winning MoneyWeek team, to help you understand what really matters when it comes to your finances.

Four times a week
Look After My Bills
Sign up to our free money-saving newsletter, filled with the latest news and expert advice to help you find the best tips and deals for managing your bills. Start saving today!
Welcome back.
Don’t miss the MoneyWeek podcast this week. Merryn talks to one of our favourite people on Twitter, Duncan Lamont of Schroders. Duncan tells Merryn where the most promising sectors in an overvalued market are right now, and they have a chat about the difficulties of getting people to be honest about ESG investing. Have a listen here.
In this week’s issue of the magazine, Dr Mike Tubbs does an excellent job of explaining how the Covid vaccines work and looking at the companies behind them. We also look at private equity funds and other ways to invest in small, fast-growing companies. Subscribe now to get your first six mags free.
MoneyWeek
Subscribe to MoneyWeek today and get your first six magazine issues absolutely FREE

Sign up to Money Morning
Don't miss the latest investment and personal finances news, market analysis, plus money-saving tips with our free twice-daily newsletter
Don't miss the latest investment and personal finances news, market analysis, plus money-saving tips with our free twice-daily newsletter
Our latest “Too Embarrassed To Ask” video looks at what “hedge funds” are. The short answer is - they’re a lot less glamorous than they look. Find out more in just over two minutes by watching our video here.
Here are the links for this week’s editions of Money Morning and other web stories you may have missed.
- Monday: Here’s why you need to take claims for ESG investing with a big pinch of salt
- Merryn’s blog: How to buy into the next big commodities bull market
- Tuesday: Tesla just bought a load of bitcoin – get ready for executive FOMO
- Wednesday: Markets are starting to bet on inflation returning – you should too
- Thursday: There’s more to soaring commodity prices than the post-Covid rebound
- Friday: Why you don’t need to worry about the GDP figure, however ugly it is
Now for the charts of the week.
The charts that matter
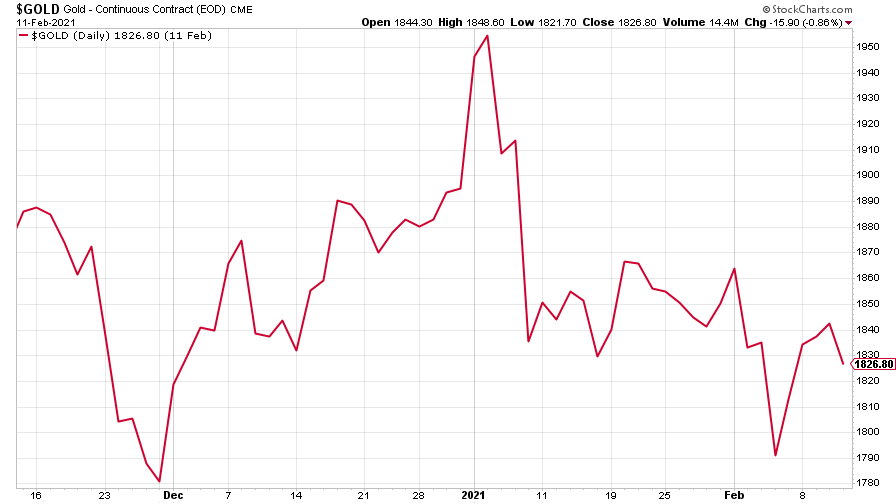
Gold recovered from last week’s lows, helped by the dollar dipping.
(Gold: three months)
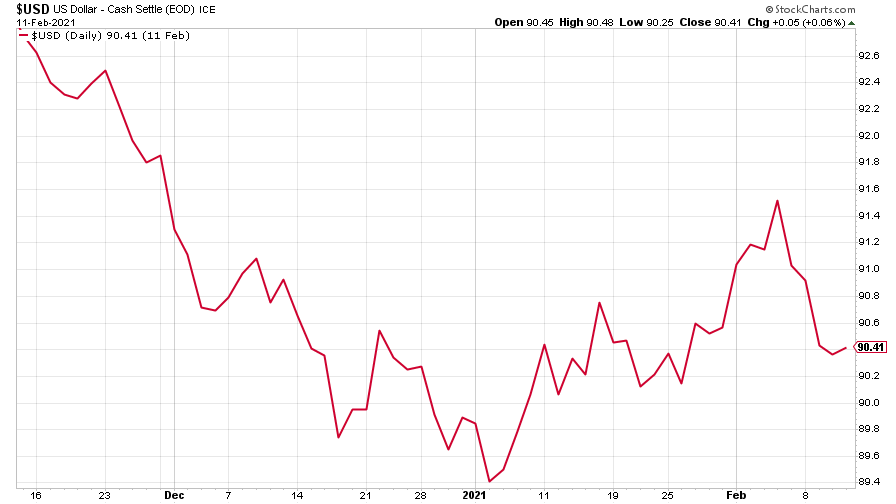
The US dollar index (DXY – a measure of the strength of the dollar against a basket of the currencies of its major trading partners) dipped this week as US economic data was weaker than had been forecast, with inflation, consumer confidence, and the latest jobless figures missing expectations.
(DXY: three months)
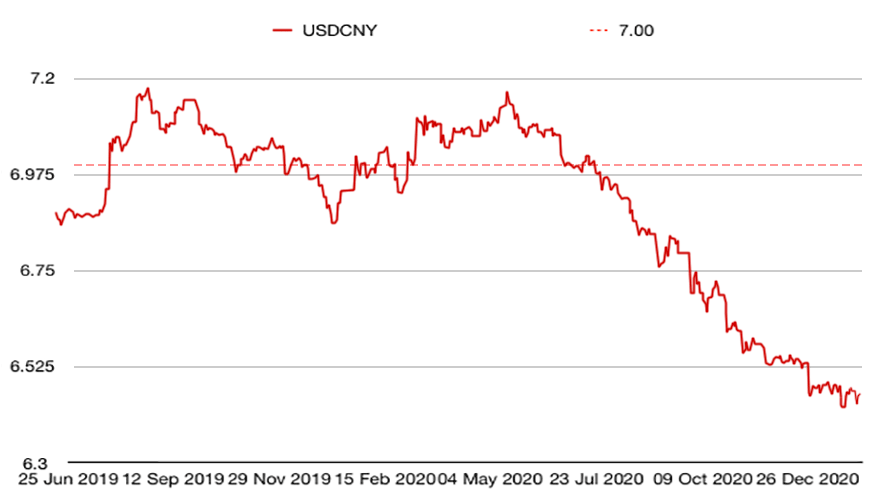
The Chinese yuan (or renminbi) was broadly flat against the US dollar (when the red line is falling, the yuan is strengthening).
(Chinese yuan to the US dollar: since 25 Jun 2019)
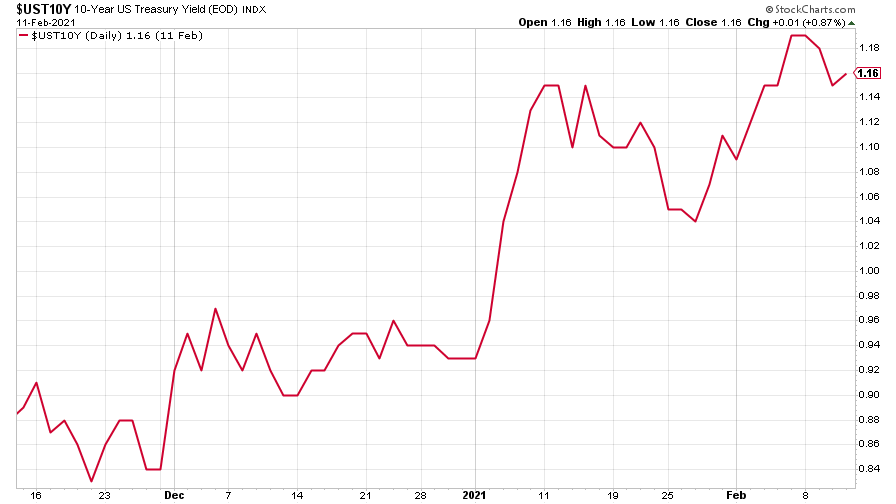
The yield on the ten-year US government bond was raring up for another shot at the 1.2% level. It’s clear that despite some mediocre economic data, investors are starting to believe the inflation story.
(Ten-year US Treasury yield: three months)
Again, one to keep an eye on is the yield on the Japanese ten-year bond.It’s still very close to 0% but it’s higher than it has been in some time.
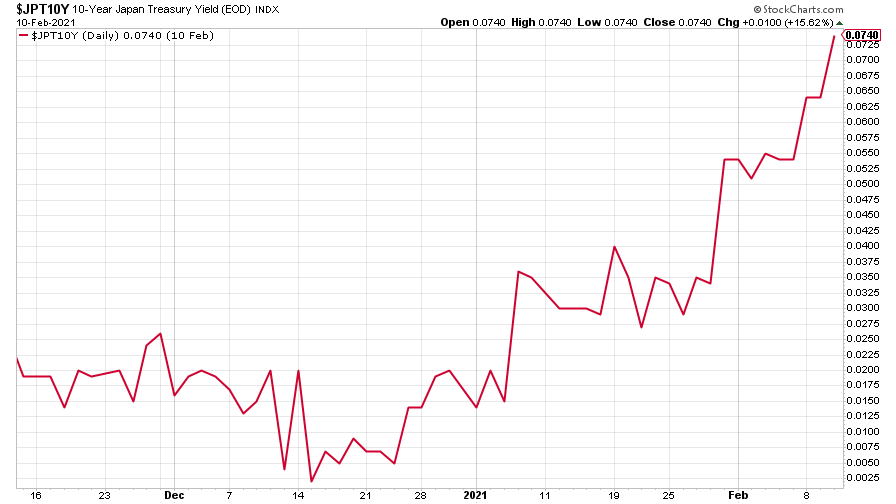
(Ten-year Japanese government bond yield: three months)
The yield on the ten-year German Bund was higher (still very negative, but higher than it has been since September 2020).
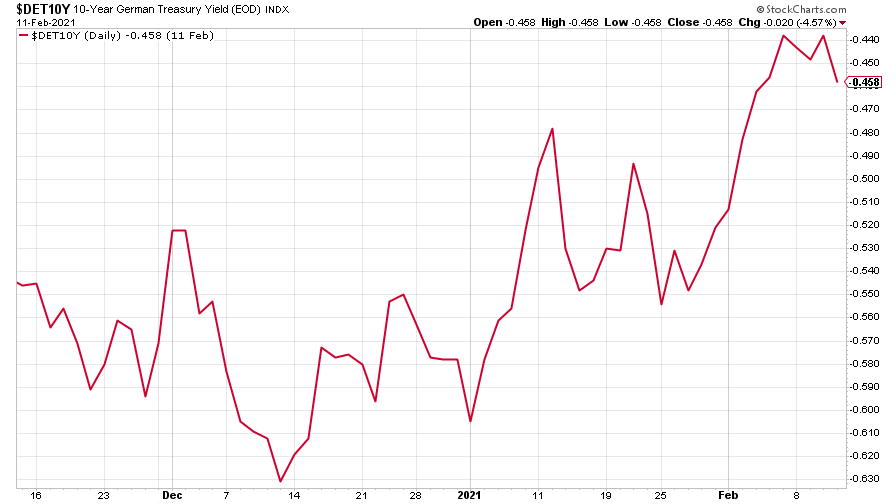
(Ten-year Bund yield: three months)
Copper surged this week. Suddenly everyone is a believer in a new commodities supercycle.
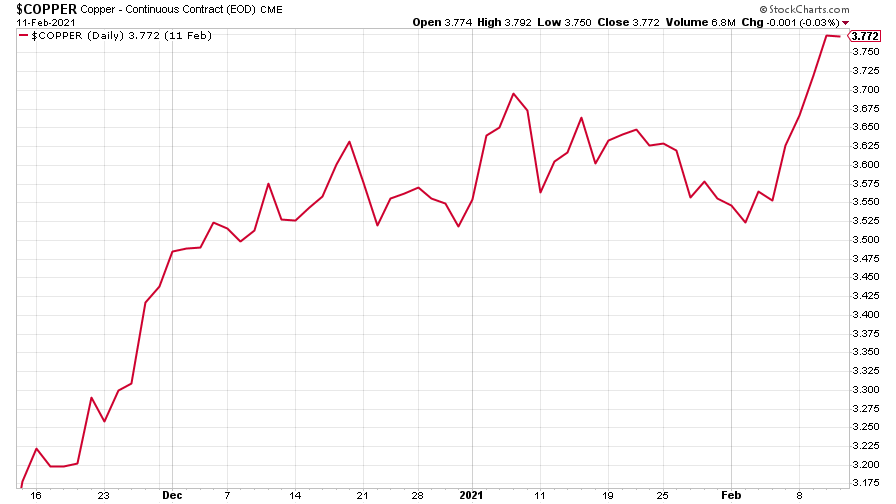
(Copper: nine months)
With commodities surging higher in general, the Aussie dollar rebounded strongly from its recent dip.
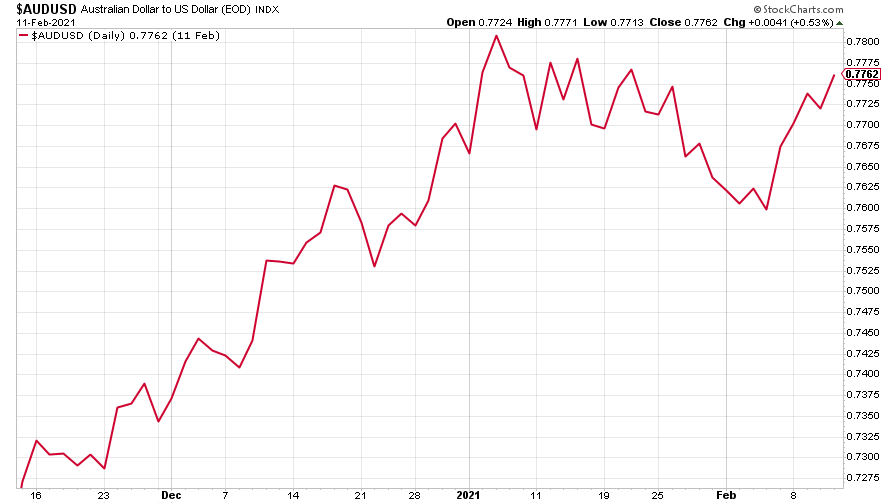
(Aussie dollar vs US dollar exchange rate: three months)
Cryptocurrency bitcoin has shot back up to a fresh all-time high after Tesla founder Elon Musk said the company was following in the footsteps of some other early adopter CEOs and putting a large chunk of its cash into the cryptocurrency. It’s funny yet strangely inevitable that two of the more speculative assets in this particular market cycle are coming together. If I’m being entirely honest with you, I think I’d rather own bitcoin than Tesla though I wouldn’t put a huge chunk of my money in either.
(I’ve just put the finishing touches on a guide to bitcoin that Dominic has put together for us – we’ll be giving you more details on how to get that next week.)
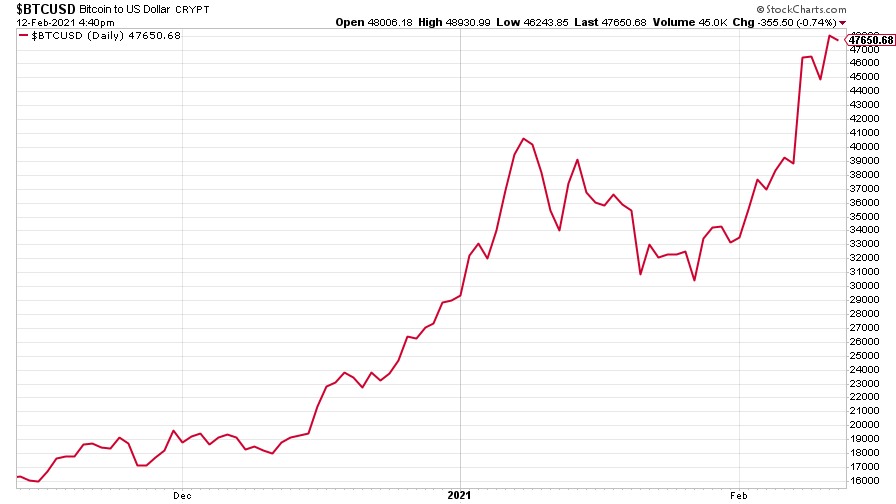
(Bitcoin: three months)
US weekly jobless claims fell to 793,000, compared to 812,000 last week (revised higher from 779,000). That was worse than economists had expected. The four-week moving average fell to 823,000 from 856,500 (which was revised higher from 849,500) the week before.
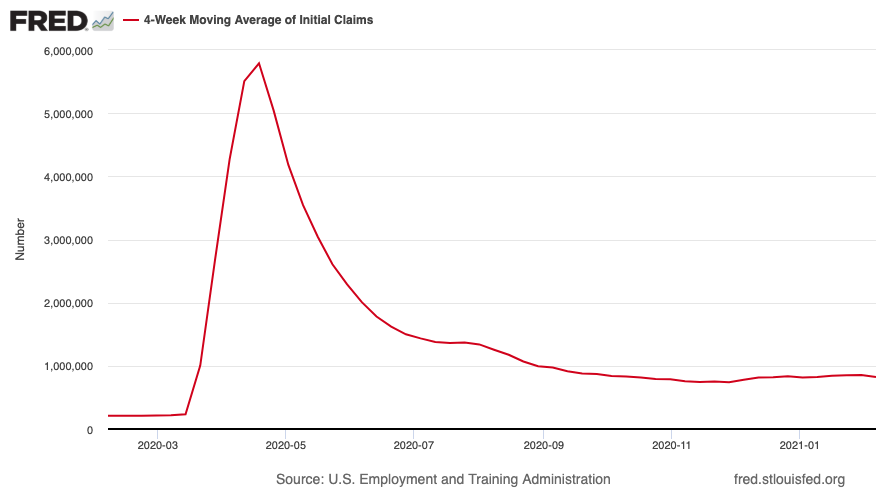
(US jobless claims, four-week moving average: since Jan 2020)
The oil price (as measured by Brent crude) surged even higher this week. It’s partly because Iran is now making uranium again, which means that Joe Biden is going to be hard-pressed if he wants to try to end sanctions against the regime. But it’s also partly because the market is finally waking up to the fact that oil is still something that we need.
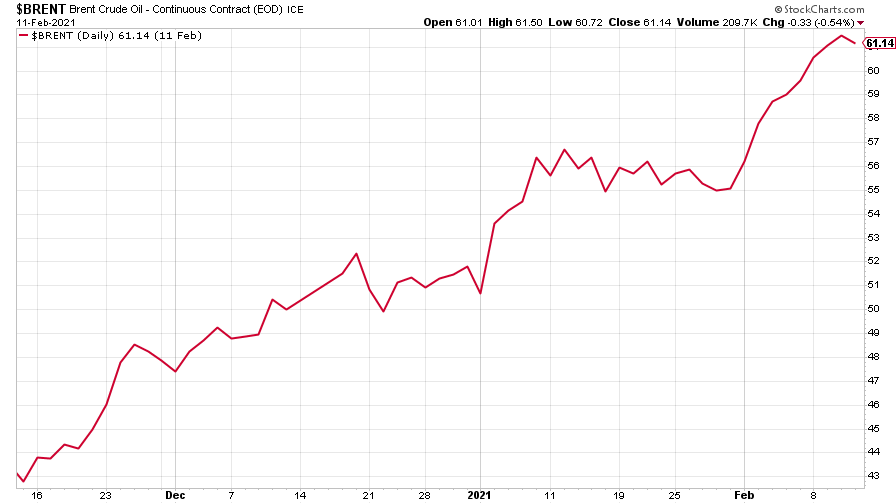
(Brent crude oil: three months)
Amazon slipped again this week. It’s still trading in that tight range that it’s been in since peaking in September last year.
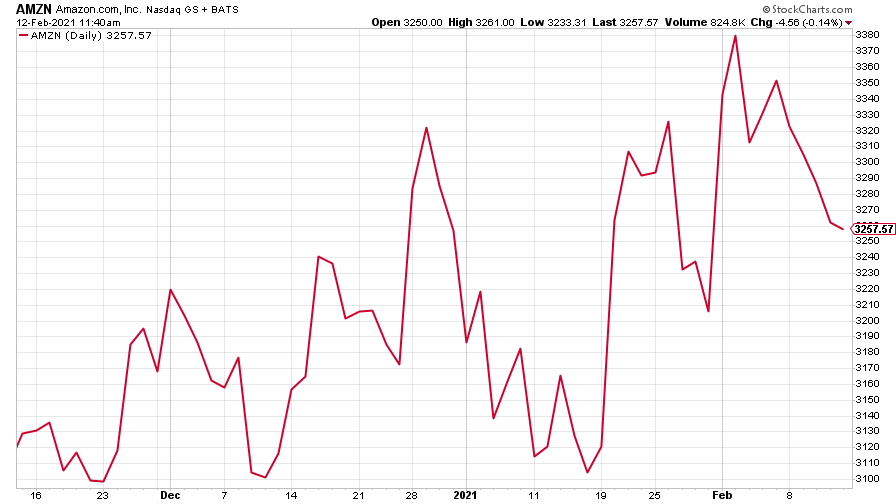
(Amazon: three months)
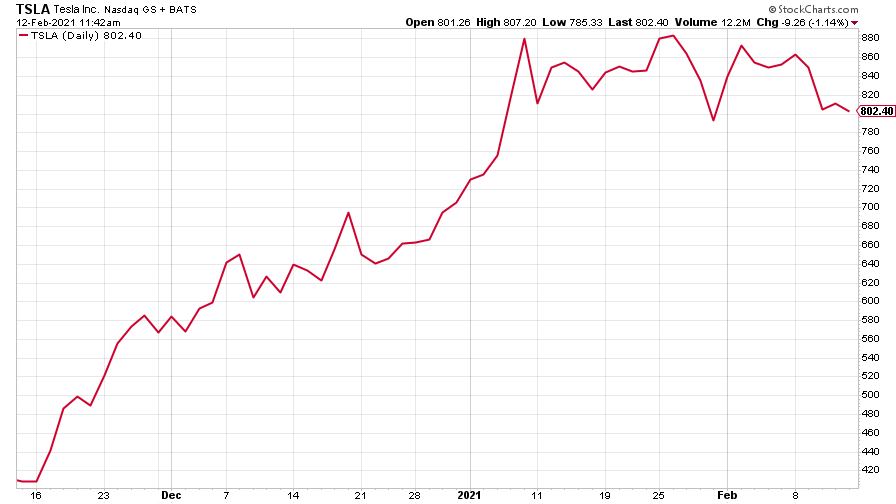
Tesla slipped this week, which is interesting, given that this is also the week that Musk announced that he’d bought bitcoin. He also talked about adding “James Bond-style” rockets to the Tesla to make it hover. I’m wondering if people are getting a bit fed up with the endless hype. One thing is for sure – I originally included Tesla here as a “blue-sky” indicator of market exuberance. I think that was the right decision. I also suspect that when the stock crashes it will crash very hard indeed.
(Tesla: three months)
Have a great weekend.
Get the latest financial news, insights and expert analysis from our award-winning MoneyWeek team, to help you understand what really matters when it comes to your finances.

-
 Average UK house price reaches £300,000 for first time, Halifax says
While the average house price has topped £300k, regional disparities still remain, Halifax finds.
-
 Barings Emerging Europe trust bounces back from Russia woes
Barings Emerging Europe trust has added the Middle East and Africa to its mandate, delivering a strong recovery, says Max King
-
 UK wages grow at a record pace
The latest UK wages data will add pressure on the BoE to push interest rates even higher.
-
 Trapped in a time of zombie government
It’s not just companies that are eking out an existence, says Max King. The state is in the twilight zone too.
-
 America is in deep denial over debt
The downgrade in America’s credit rating was much criticised by the US government, says Alex Rankine. But was it a long time coming?
-
 UK economy avoids stagnation with surprise growth
Gross domestic product increased by 0.2% in the second quarter and by 0.5% in June
-
 Bank of England raises interest rates to 5.25%
The Bank has hiked rates from 5% to 5.25%, marking the 14th increase in a row. We explain what it means for savers and homeowners - and whether more rate rises are on the horizon
-
 UK inflation remains at 8.7% ‒ what it means for your money
Inflation was unmoved at 8.7% in the 12 months to May. What does this ‘sticky’ rate of inflation mean for your money?
-
 Would a food price cap actually work?
Analysis The government is discussing plans to cap the prices of essentials. But could this intervention do more harm than good?
-
 Is my pay keeping up with inflation?
Analysis High inflation means take home pay is being eroded in real terms. An online calculator reveals the pay rise you need to match the rising cost of living - and how much worse off you are without it.