Rightmove will go wrong
Rightmove, the online property portal, is too pricey given the poor outlook for housing.

You are now subscribed
Your newsletter sign-up was successful
Want to add more newsletters?

Twice daily
MoneyWeek
Get the latest financial news, insights and expert analysis from our award-winning MoneyWeek team, to help you understand what really matters when it comes to your finances.

Four times a week
Look After My Bills
Sign up to our free money-saving newsletter, filled with the latest news and expert advice to help you find the best tips and deals for managing your bills. Start saving today!

The property portal is too pricey given the poor outlook for housing.
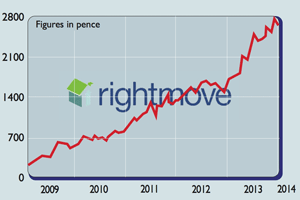
It's been a turbulent year for shareholders in online estate agency Rightmove (LSE: RMV). This time last year shares were around 400p. By this summer they had surged to a peak of around 540p. However, over the last six months they have performed poorly, relinquishing most of their gains. The net result is that if you had bought them last December and held on, you would have made a solid 10% return. Should you stick with them, or are they set to fall?
We think it is more likely to be the latter. In the past you had to trawl through the website of each individual estate agent (or visit their offices) if you wanted to find out what was available. By creating a single website where you can search online for what is on sale in any particular area, Rightmove made the process of researching and buying a house far more transparent. However, the problem is that Rightmove relies on fees from estate agents for its revenue, and greater transparency has also reduced the amount of money estate agents can charge.
MoneyWeek
Subscribe to MoneyWeek today and get your first six magazine issues absolutely FREE

Sign up to Money Morning
Don't miss the latest investment and personal finances news, market analysis, plus money-saving tips with our free twice-daily newsletter
Don't miss the latest investment and personal finances news, market analysis, plus money-saving tips with our free twice-daily newsletter
Limited scope for further growth
Rightmove's rapid acceptance is also a double-edged sword. On the one hand, the fact that virtually all property-hunters and estate agents use it means even estate agents who don't like it have to use it; if they don't there is a risk that they won't be able to sell their clients' properties.
However, having a large portion of the industry signed up already means that it is hard to see where future growth is going to come from. Indeed, figures it released in July suggested that the number of individual estate agents who were members had increased by only 0.5% year on year. All this wouldn't matter so much if the property market was still booming. But all the indications are that the housing market has peaked. Even in the best- case scenario, house prices will probably endure a correction. Since estate agent commissions are linked to house prices, this will hit Rightmove's revenue base.
That's bad enough, but given that house prices are still at record multiples of average earnings, it is more likely that we could see a much more dramatic fall in prices until affordability is restored. Given the discouraging market outlook, the fact Rightmove trades at 22.7 times 2019 earnings makes it seem far too expensive.
Overall, we'd suggest this is a good time to short Rightmove at the current price of 454p. While IG Index has a minimum of £1 per 1p, we'd suggest you increase this to £8 per 1p. With a recommended stop-loss of 667p, this means that your potential downside would be £904.
How my tips have fared
Both American and British markets have rallied over the past fortnight thanks to the US Federal Reserve sending out dovish signals and a possible thawing in US-China relations. However, both our long and our short positions have had mixed fortunes.
At the start of the period we had six long positions: Greene King, Shire, Next, Saga, Cineworld and John Laing Group. Greene King and Cineworld both rose, with the pub group surging from 504p to 555p and Cineworld rising from 270p to 283p.
However, both Saga and John Laing Group were essentially unchanged at 114p and 324p respectively, while Shire fell from £46.07 to £45.98. Worse, Next plunged from £51.50 to £48.54, which triggered our stop-loss, which was set at £50. Overall, only two of the long positions are making money, with total net losses of £716.
As for our six shorts, three fell and three rose. Bitcoin continued its fall and is now around $4,096 (from $4,357), which means that the position is making us £1,782. Twitter also slipped, from $31.98 to $31.45, while Weis declined from $48.50 to $46.53. But Just Eat rose from 531p to 601p and Snap went from $6.05 to $6.51. Netflix also rose from $271 to $286. Overall, five of our six shorts are in the black, making a total net profit of £2,670.
When you take into account the amount of money we've lost on our closed positions, it means that we're essentially breaking even. Since we're forced to close out Next, I'm not going to close any other of our positions.
However, I am going to increase the stop-loss on Greene King to 500p and lower the one on bitcoin to £6,000 to lock in some more profits. I'm also going to advise you to take profits on our bitcoin position if it falls below £3,000.
Trading techniques... fashion fundamentals
Most investors turn to the financial pages to follow the markets. But should you turn to the fashion section instead? One measure of market sentiment is the hemline indicator. This posits that shorter dresses tend to signal an economic expansion and a bull market, while longer skirts are more in fashion during periods of market turbulence.
The rationale is that shorter skirts tend to signal a desire for luxury over practicality, suggesting that consumers are more optimistic that the economy and markets will do well enough to justify the additional expense.
There is some historical evidence to support this theory, first proposed by Professor George Taylor of Wharton School of Business in 1926. During the bull market of the Roaring Twenties, when market prices rose nearly fivefold in eight years, short skirts and the "flapper" look were in fashion. By contrast, plainer fashions predominated in the decade following the Wall Street Crash in 1929. Similarly, miniskirts were fashionable during the bull market of the 1960s, but long, flared jeans took over during the stagflation and market turmoil of the 1970s. However, while there does seem to be a relationship between the economic cycle and the length of women's skirts, fashion seems to be a lagging indicator. A 2010 paper by Marjolein van BaardwijkandPhilip Hans Franses of Erasmus University Rotterdam found that skirt hemlines were most closely correlated with what happened in the economy three years ago.
Because the stockmarket tends to lead the economic cycle, this suggests that by the time fashions have shifted, the stockmarket has already moved. However, the failure of the hemline index to deliver meaningful information hasn't stopped others trying to find alternatives based around haircuts or even sales of cosmetics.

-
 Average UK house price reaches £300,000 for first time, Halifax says
While the average house price has topped £300k, regional disparities still remain, Halifax finds.
-
 Barings Emerging Europe trust bounces back from Russia woes
Barings Emerging Europe trust has added the Middle East and Africa to its mandate, delivering a strong recovery, says Max King


-
 Rightmove: Asking prices rise by 0.3%, but increase is lower than typical for October
October saw asking prices grow by £1,165 on average, Rightmove says, but the increase is far below the usual autumn bump as the property market braces for next month’s Budget.
-
 Three UK stocks for long-term growth
UK Stocks Professional investor Nick Train picks three UK stocks to invest in the British boom.
-
 Rightmove: property asking prices hit record high
News Rising demand for top of the ladder home is boosting asking prices, Rightmove research shows. Is now a good time to sell a property?
-
 Shares in focus: The Google of Britain's housing boom
Features Property website Rightmove has enjoyed tremendous success, says Phil Oakley. But can it deliver for shareholders?


