You are now subscribed
Your newsletter sign-up was successful
Want to add more newsletters?

Twice daily
MoneyWeek
Get the latest financial news, insights and expert analysis from our award-winning MoneyWeek team, to help you understand what really matters when it comes to your finances.

Four times a week
Look After My Bills
Sign up to our free money-saving newsletter, filled with the latest news and expert advice to help you find the best tips and deals for managing your bills. Start saving today!
"In this era of Big Data, UK statistics-gathering is neolithic," writes Philip Aldrick in The Times. Data on inflation is "collected by researchers wandering around shops with a clipboard". Employment figures rely on household questionnaires.
MoneyWeek
Subscribe to MoneyWeek today and get your first six magazine issues absolutely FREE

Sign up to Money Morning
Don't miss the latest investment and personal finances news, market analysis, plus money-saving tips with our free twice-daily newsletter
Don't miss the latest investment and personal finances news, market analysis, plus money-saving tips with our free twice-daily newsletter
-
 MoneyWeek Talks: The funds to choose in 2026
Podcast Fidelity's Tom Stevenson reveals his top three funds for 2026 for your ISA or self-invested personal pension
-
 Three companies with deep economic moats to buy now
Opinion An economic moat can underpin a company's future returns. Here, Imran Sattar, portfolio manager at Edinburgh Investment Trust, selects three stocks to buy now


-
 The charts that matter: bond yields and US dollar continue to climb
Charts The US dollar and government bond yields around the world continued to climb. Here’s what happened to the charts that matter most to the global economy.
-
 The charts that matter: markets start the year with a crash
Charts As markets start 2022 with a big selloff, here’s what happened to the charts that matter most to the global economy.
-
 The charts that matter: Fed becomes more hawkish
Charts Gold rose meanwhile the US dollar fell after a key Fed meeting. Here’s what else happened to the charts that matter most to the global economy.
-
 The charts that matter: a tough week for bitcoin
Charts Cryptocurrency bitcoin slid by some 20% this week. Here’s what else happened to the charts that matter most to the global economy.
-
 The charts that matter: omicron rattles markets
Charts Markets were rattled by the emergence of a new strain of Covid-19. Here’s how it has affected the charts that matter most to the global economy.
-
 The charts that matter: the US dollar keeps on strengthening
Charts The US dollar saw further rises this week as gold and cryptocurrencies sold off. Here’s how that has affected the charts that matter most to the global economy.
-
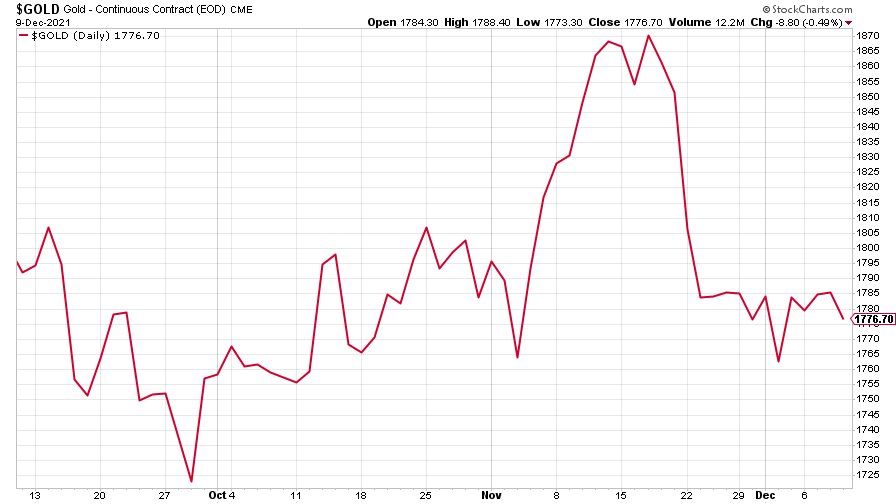
 The charts that matter: gold hangs on to gains while the dollar continues higher
Charts The gold price continued to hang on to last week’s gains, even as the US dollar powered higher this week. Here’s how that has affected the charts that matter most to the global economy.
-
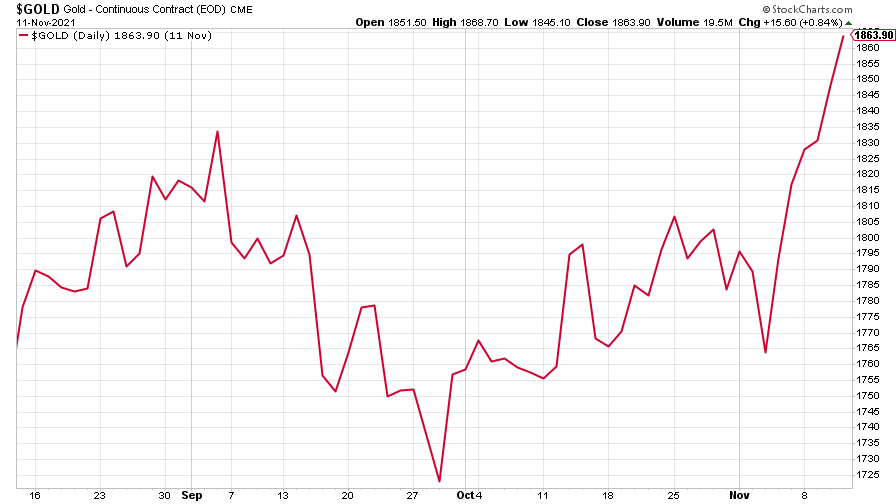 The charts that matter: inflation fears give gold a much needed boost
Charts US inflation hit its highest in 30 years this week, driving gold and bitcoin to new highs. Here’s how that has affected the charts that matter most to the global economy.


