
-
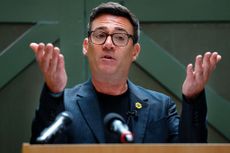 Can Andy Burnham’s Manchesterism work for Britain?
Andy Burnham wants to spread his “Manchesterism” to the rest of the country. But what is it, and will it work?
-
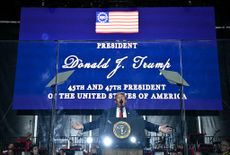 L'État, c'est Trump – how America's “Sun King” is cashing in
Donald Trump has treated the US presidency as a personal cash machine and is the most corrupt holder of that office in the country's history, says Jane Lewis
-
 The £6,000 annual cost of going self-employed and how to avoid it
Going self-employed brings plenty of flexibility but you also have to forego workplace perks such as pensions and holiday pay.
-
 Will the new Labour leader remove the pension triple lock?
The triple lock has served pensioners well, but its sustainability has been questioned over and over again. Will Andy Burnham shield it as Labour leader?
-
 How asset finance can help your company grow
Asset finance can make more sense than a bank loan for a small business – but seek advice before signing on, says David Prosser
-
 Andy Burnham should devolve power to the market
Opinion If Andy Burnham is really so keen on devolution, he should hand power to consumers, not mayors, says Matthew Lynn
Opinion -
 Why Britain needs air conditioning now
Arguments against the mass adoption of air conditioning in the UK and the rest of Europe once made sense, but not any more. Why have times changed?
-
 Why emerging market funds are over-concentrated in East Asia
The MSCI Emerging Markets Index is now a proxy for just one region – and increasingly one sector. Here's how to gain more traditional exposure
-
 Who is Andy Burnham, the ‘Manchester messiah’?
Andy Burnham's arrival on the national political stage has been hailed enthusiastically by his supporters. But what kind of a man is he?


