How to trade the Dow with minimal stress
This is about as stress-free a trading style as I can imagine, says John C Burford. All you have to do is manage the trade.
Get the latest financial news, insights and expert analysis from our award-winning MoneyWeek team, to help you understand what really matters when it comes to your finances.
You are now subscribed
Your newsletter sign-up was successful
Want to add more newsletters?

Twice daily
MoneyWeek
Get the latest financial news, insights and expert analysis from our award-winning MoneyWeek team, to help you understand what really matters when it comes to your finances.

Four times a week
Look After My Bills
Sign up to our free money-saving newsletter, filled with the latest news and expert advice to help you find the best tips and deals for managing your bills. Start saving today!
In this issue of Trader, I want to talk about one of my favourite entry techniques. But first, I want to give you a quick update on Apple shares, which have taken a bit of a beating.
Don't say I didn't warn you! In my post of 10 July ("I've spotted a problem facing four stockmarket darlings"), I noted that Apple appeared vulnerable to a decline from current levels. This was the daily chart I showed:
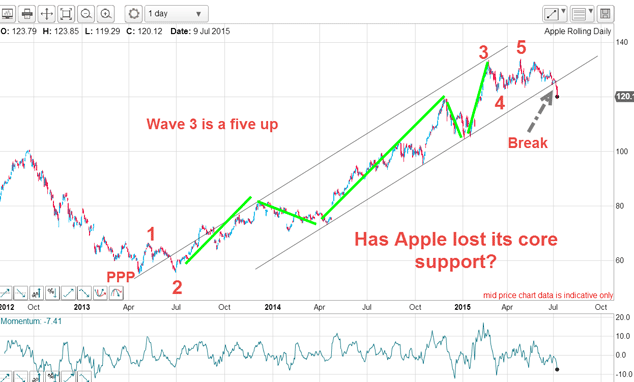
The rally from the early 2013 lows can be counted as a complete five up. It also travelled within the lovely trading channel contained between my tramline pair. So the break of the lower tramline was a significant event and gave a warning to the bulls to expect some choppy waters ahead, as I noted back then.
MoneyWeek
Subscribe to MoneyWeek today and get your first six magazine issues absolutely FREE

Sign up to Money Morning
Don't miss the latest investment and personal finances news, market analysis, plus money-saving tips with our free twice-daily newsletter
Don't miss the latest investment and personal finances news, market analysis, plus money-saving tips with our free twice-daily newsletter
Last night, Apple's eagerly-awaited results were revealed. The market did not like what it saw, and sold off hard. Here is the current chart:
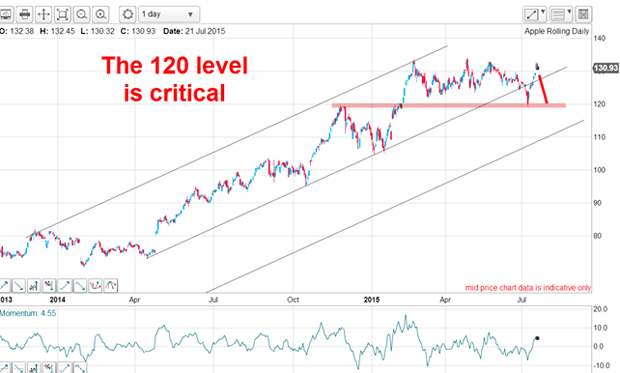
Last week, the market did try to punch up into new highs above 130, but failed and is currently in the 120 area in out-of-hours trading. That 120 level is critical because it represents huge chart support. The 120 high made last November on the run up is a significant chart point. Breaking hard below that level would indeed be very bearish.
Now, on to the Dow.
Has the Dow topped?
But what a difference a day makes! Now, results are coming in below even modest expectations and stock markets were hit hard yesterday.
Recall from last Friday's post, I expected this decline in the chart I showed:
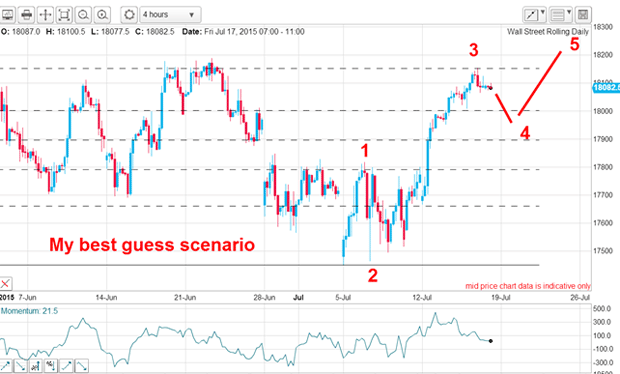
My best guess was for a decline off the 78% Fibonacci level (wave 3 high) into wave 4 down. It could then be set up for a rally in wave 5 into new highs.
But of course, there is always an alternative scenario. And that would imply last week's high was the full extent of the rally and the market is set for a full-on decline. That would make the rally a three-wave A-B-C instead.
I had the perfect chance to use a wonderful trading trick
This was the chart yesterday as the market was in decline:
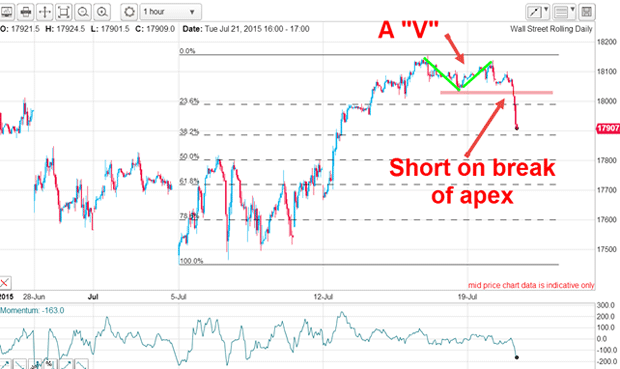
At the top, the market traced out a clear 'V' as marked in green. From the first high, the market moved down and then back up to the area of the first high. It then moved down. This has created a 'mini' double top.
The ideal procedure is to set a sell-stop order just below the apex of the 'V' (pink bar) and wait. Then, if the market hits your sell stop, you are in at a very favourable price. Your protective stop can then be set quite close to entry giving you a low-risk trade.
I really like this trade entry method because I can determine my entry and protective stop ahead of time. This allows me to reduce my stress levels always a good thing! I highly recommend this technique.
OK, how does it look this morning?
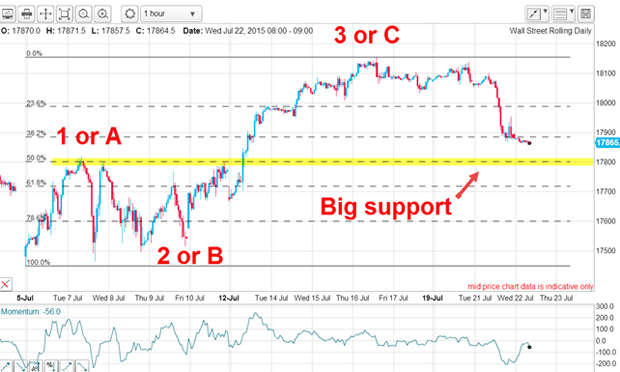
The move down yesterday was certainly impulsive (that is, a strong directional move), and that suggests the trend has changed. There lies big support at the Fibonacci 50% level, so further downside progress from there appears limited.
But the decline still has only an A-B-C feel to it, which means the wave 4 interpretation is still alive.
But a trade entry at the 18,030 level would currently be in profit by almost 200 pips, and so I can move my protective stop to break even.
Now, I have a no-loss trade working which could turn into something more valuable. This is about as stress-free a trading style as I can imagine. I do not have to worry about getting it wrong the only problem I have is how to manage the trade, and that is a lovely problem to have.
Get the latest financial news, insights and expert analysis from our award-winning MoneyWeek team, to help you understand what really matters when it comes to your finances.
John is is a British-born lapsed PhD physicist, who previously worked for Nasa on the Mars exploration team. He is a former commodity trading advisor with the US Commodities Futures Trading Commission, and worked in a boutique futures house in California in the 1980s.
He was a partner in one of the first futures newsletter advisory services, based in Washington DC, specialising in pork bellies and currencies. John is primarily a chart-reading trader, having cut his trading teeth in the days before PCs.
As well as his work in the financial world, he has launched, run and sold several 'real' businesses producing 'real' products.
-
 MoneyWeek news quiz: Can you get smart meter compensation?
Smart meter compensation rules, Premium Bonds winners, and the Bank of England’s latest base rate decision all made the news this week. How closely were you following it?
-
 Adventures in Saudi Arabia
Travel The kingdom of Saudi Arabia in the Middle East is rich in undiscovered natural beauty. Get there before everybody else does, says Merryn Somerset Webb