The Dow has been too murky to trade
The Dow Jones has been a hard market to read recently, says John C Burford. But now the fog is beginning to clear.
Get the latest financial news, insights and expert analysis from our award-winning MoneyWeek team, to help you understand what really matters when it comes to your finances.
You are now subscribed
Your newsletter sign-up was successful
Want to add more newsletters?

Twice daily
MoneyWeek
Get the latest financial news, insights and expert analysis from our award-winning MoneyWeek team, to help you understand what really matters when it comes to your finances.

Four times a week
Look After My Bills
Sign up to our free money-saving newsletter, filled with the latest news and expert advice to help you find the best tips and deals for managing your bills. Start saving today!
It has been some time since I covered the Dow. The main reason is that the chart patterns were very confused (at least they were to me). What appeared to be the start of a major leg down off the 19 May high actually turned out to be something else and that has only become apparent to me in recent days.So today, I believe I have a better handle on the patterns now forming.
Incidentally, I have noted before the yawning gap between the stockmarket and the real US economy. When the economic news was poor, stocks got a boost. It was a case of bad news equals good. Investors were led to believe that the Fed would be less inclined to raise interest rates, which would have a bullish impact on stocks.
Both consumers and companies have been adding debt at manic levels as their borrowing costs were low. But even a small increase in loan repayments could disrupt that. In the media, there have been ample recent scare stories of calamity ahead, for house prices as well as shares. This barrage of gloom-and-doom articles almost assures that if it does happen, it will not be on the time-scale envisaged!
MoneyWeek
Subscribe to MoneyWeek today and get your first six magazine issues absolutely FREE

Sign up to Money Morning
Don't miss the latest investment and personal finances news, market analysis, plus money-saving tips with our free twice-daily newsletter
Don't miss the latest investment and personal finances news, market analysis, plus money-saving tips with our free twice-daily newsletter
One example of this bad- equals- good effect was vividly shown on Tuesday when the US Treasury released a raft of economic data. With eight of the ten components falling, the data pointed to weakness in the second half of this year. Earnings fell 10 points, followed by current job openings and company expansion (down 5 points). Here are some of the other figures released this week:
NFIB Small Business Optimism Index
Eight of the ten components fell, pointing to weakness in the second half of this year. Earnings fell ten points, followed by current job openings and company expansion (down five points).
The small business sector is usually the first to signal a downturn and this data is certainly not supportive of the idea of an expanding economy.
Retail Sales
Are US consumers spending like gangbusters in this recovery'?
Import and Export Prices
Has deflation been conquered by the Fed and is CPI (consumer price index) heading towards their desired 2% target when they say they will raise rates?
Redbook (chain store sales)
Business Inventories
Ratio of inventories/sales is pushing 1.36 a multi-year high. Are final sales booming? Is this indicating an uptick in inflation?
I have put on my rose-tinted specs and still do not see a bullish picture for the US economy and inflation. But hey no problem for stocks, they kept up the rally anyway. We know that the economy is not the stockmarket, so let's turn to the charts.
Why the Dow's worth trading now
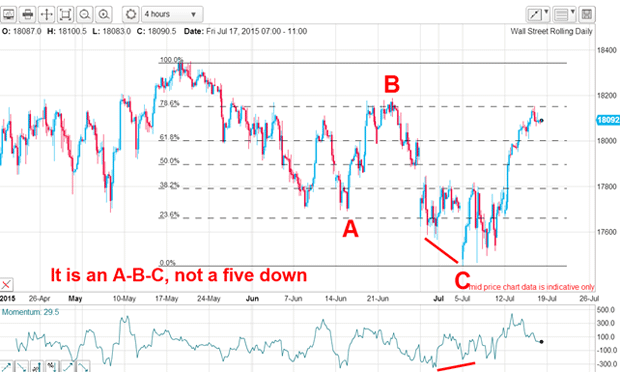
My first guess was that wave A was wave 1, wave B was wave 2. When the market moved below the A wave low on Monday 29 June, that set up the real possibility that we were in wave 3 of a five down. To confirm my suspicion, I needed to see the very sharp decline which is the hallmark of a third wave.
But when the market made a large positive-momentum divergence a week later and then sharply recovered I knew my third wave idea was in big trouble. That was when I decided to just stand aside and watch.
When the market moved higher to close the gap, that raised the odds much higher for a new all-time high up ahead. This was an alternative outcome I had considered for some time.
But with that spike low of 5 July, which I could see was a major low, I went back to the long-term daily chart to find possible tramlines and found a superb pair! The 5 July low had given me the perfect touch point for my lower tramline with the added benefit that now I have an upper target: on the upper tramline.
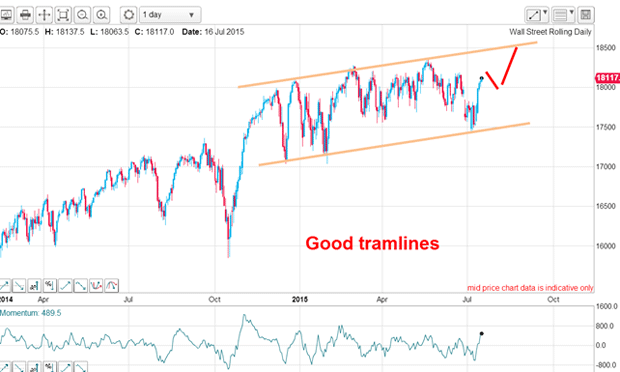
If the market could move up to my upper tramline in the 18,500 18,600 area, that would complete a major five up on the weekly chart.
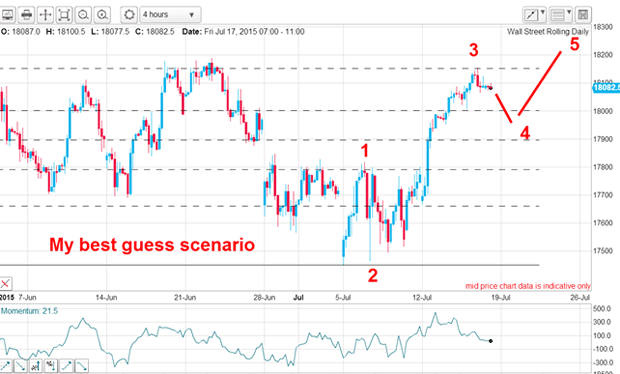
So in this scenario, what are the short-term prospects? The rally off the 5 July spike low is in three waves so far. My wave 3 has the typical long and strong look of a third wave and I expect a dip in wave 4 leading to a further rally in wave 5.
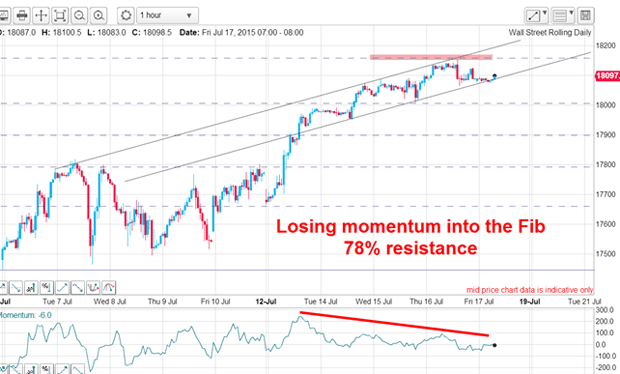
Let's see if I can pinpoint where wave 4 will appear. On the hourly chart and I have a nice small tramline pair working. But the market has rapidly lost momentum as it climbed into the Fibonacci 78% resistance.
A break of the lower line would likely set off the start of wave 4 down.
So now I have a clear roadmap. Of course, this could be negated if the market does start to pay attention to the deflationary global scenario now unfolding. And my eyes will be on the outcome of the Greece/EU war, and whether there will be any debt write-off. If German resistance can be overcome, that would open the floodgates to more unpayable sovereign debt being next in line. The stakes could not be higher.
Get the latest financial news, insights and expert analysis from our award-winning MoneyWeek team, to help you understand what really matters when it comes to your finances.
John is is a British-born lapsed PhD physicist, who previously worked for Nasa on the Mars exploration team. He is a former commodity trading advisor with the US Commodities Futures Trading Commission, and worked in a boutique futures house in California in the 1980s.
He was a partner in one of the first futures newsletter advisory services, based in Washington DC, specialising in pork bellies and currencies. John is primarily a chart-reading trader, having cut his trading teeth in the days before PCs.
As well as his work in the financial world, he has launched, run and sold several 'real' businesses producing 'real' products.
-
 MoneyWeek news quiz: Can you get smart meter compensation?
Smart meter compensation rules, Premium Bonds winners, and the Bank of England’s latest base rate decision all made the news this week. How closely were you following it?
-
 Adventures in Saudi Arabia
Travel The kingdom of Saudi Arabia in the Middle East is rich in undiscovered natural beauty. Get there before everybody else does, says Merryn Somerset Webb