Where to now for gold?
Following gold's recent plunge, John C Burford draws a new set of tramlines. But will gold rally from here or fall through the floor? The result could be explosive.
Get the latest financial news, insights and expert analysis from our award-winning MoneyWeek team, to help you understand what really matters when it comes to your finances.
You are now subscribed
Your newsletter sign-up was successful
Want to add more newsletters?

Twice daily
MoneyWeek
Get the latest financial news, insights and expert analysis from our award-winning MoneyWeek team, to help you understand what really matters when it comes to your finances.

Four times a week
Look After My Bills
Sign up to our free money-saving newsletter, filled with the latest news and expert advice to help you find the best tips and deals for managing your bills. Start saving today!
In my last post on gold, I stated that the relief rally from the plunge low of $1,530 on 26 September was over and to expect a resumption of the bear market.
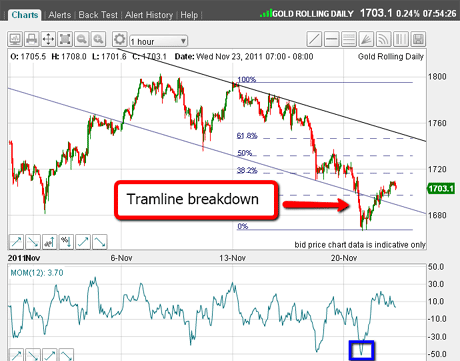
Since I wrote that, when gold was trading at the $1,725 area, the market followed my script and plunged to a low of $1,670 on Monday.
Below is the chart.
MoneyWeek
Subscribe to MoneyWeek today and get your first six magazine issues absolutely FREE

Sign up to Money Morning
Don't miss the latest investment and personal finances news, market analysis, plus money-saving tips with our free twice-daily newsletter
Don't miss the latest investment and personal finances news, market analysis, plus money-saving tips with our free twice-daily newsletter
I have drawn in my original tentative tramlines, and Monday's plunge took the market well below my lower tramline on a hugely oversold momentum reading (marked by the blue box in the chart below).
This extreme tramline violation, together with the normal relief rally, puts my original tramline set-up in doubt. When I see a market make such a large move outside of a tramline and bounce back up through it, I feel the need to seek another tramline set-up and scrap the original one.

(Click on the chart for a larger version)
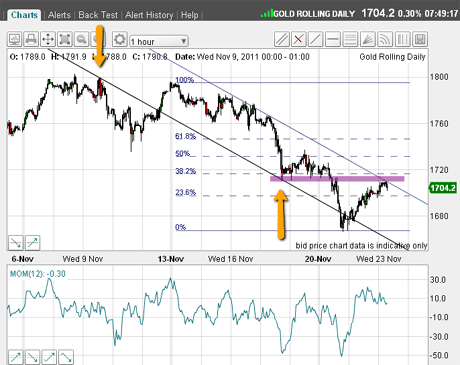
And that is what I have done. Here is a better tramline pair:

(Click on the chart for a larger version)
I have two superb anchor points for the lower tramline marked by the yellow arrows, and the overshoot at the $1,670 low is of a reasonable size, unlike the situation in the first chart.
There is such a thing as looking right' in charting.
For instance, we all know that market highs and lows do not follow straight lines with mathematical precision.
You must always expect some leeway: some over- or under-shoot of line projections is normal.
We often see this in the Fibonacci retracements. As traders working in the real world, we need to make allowances for this. How much deviation from the perfect' a trader allows is, of course, subjective and that is why I always consider charting as much an art as a science.
Shiny new tramlines for gold
OK, back to the tramlines - I also like the upper tramline, as it catches last Wednesday's tops and the market is resting right on it.
What a great set-up for a short trade here at the $1,706 area! Not only is the market trading right on my tramline, but momentum is in the overbought region.
The market has not yet reached the Fibonacci 38% retrace and may not, as the market is in a large third Elliott wave much as is the picture in the Dow, as I explained in yesterday's post.
And don't forget, gold is also in a much larger third Elliott wave off the double-top at the all-time high of $1,920, as shown in the 18 November post.
So the Elliott wave set-up in gold and the Dow are remarkably similar!
This demonstrates the fact that gold may not be, contrary to common wisdom, a hedge against financial turmoil. If and when the Dow makes a huge leap down, gold is likely to follow.
Also, the market has rallied right up to the chart resistance marked by the purple bar (as you can see in the earlier chart, which I've repeated below). This is usually an area where rallies turn around, especially in strong bear markets.

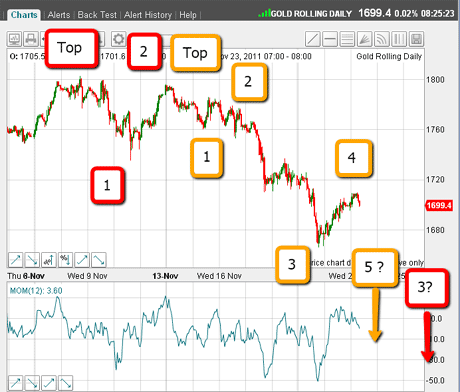
In terms of the Elliott wave count, here is my working model:

We are this morning completing wave 4 (yellow) and should embark on a large wave 5 (yellow) down, co-incident with the larger-scale wave 3 (red). This combination should be explosive.
If I am wrong, my short sale will be protected by a 3% rule stop. And if triggered, I will let the market settle into a new pattern before searching out another low-risk entry.
Once again, my target is for gold to fall to much lower levels.
Because of the US Thanksgiving holiday, trading hours are curtailed tomorrow and Friday and my next post willbe on Monday.
If you're a new reader, or need a reminder about some of the methods I refer to in my trades, then do have a look at my introductory videos:
Advanced trading with Elliott waves
An introduction to Elliott wave theory
The essentials of tramline trading
Don't miss my next trading insight. To receive all my spread betting blog posts by email, as soon as I've written them, just sign up here .
Get the latest financial news, insights and expert analysis from our award-winning MoneyWeek team, to help you understand what really matters when it comes to your finances.
John is is a British-born lapsed PhD physicist, who previously worked for Nasa on the Mars exploration team. He is a former commodity trading advisor with the US Commodities Futures Trading Commission, and worked in a boutique futures house in California in the 1980s.
He was a partner in one of the first futures newsletter advisory services, based in Washington DC, specialising in pork bellies and currencies. John is primarily a chart-reading trader, having cut his trading teeth in the days before PCs.
As well as his work in the financial world, he has launched, run and sold several 'real' businesses producing 'real' products.
-
 Average UK house price reaches £300,000 for first time, Halifax says
While the average house price has topped £300k, regional disparities still remain, Halifax finds.
-
 Barings Emerging Europe trust bounces back from Russia woes
Barings Emerging Europe trust has added the Middle East and Africa to its mandate, delivering a strong recovery, says Max King