The Elliott waves in gold are coming into focus
Since last writing about gold, the market has fallen back. John C Burford's Elliott wave count is coming good.
Get the latest financial news, insights and expert analysis from our award-winning MoneyWeek team, to help you understand what really matters when it comes to your finances.
You are now subscribed
Your newsletter sign-up was successful
Want to add more newsletters?

Twice daily
MoneyWeek
Get the latest financial news, insights and expert analysis from our award-winning MoneyWeek team, to help you understand what really matters when it comes to your finances.

Four times a week
Look After My Bills
Sign up to our free money-saving newsletter, filled with the latest news and expert advice to help you find the best tips and deals for managing your bills. Start saving today!
When I left gold on 10 November, I was short at the $1,780 level. After a quick drop to the $1,760 level, I was expecting a rally back to the $1,775 area.
The market performed as expected by rallying precisely to $1,775, and then began a more serious decline.
This terminated at last Thursday's $1,735 spike low, which was an opportunity to take a short-term profit.
MoneyWeek
Subscribe to MoneyWeek today and get your first six magazine issues absolutely FREE

Sign up to Money Morning
Don't miss the latest investment and personal finances news, market analysis, plus money-saving tips with our free twice-daily newsletter
Don't miss the latest investment and personal finances news, market analysis, plus money-saving tips with our free twice-daily newsletter
I had expected the market to respect that $1,775 rally high, but it was not to be. The market re-wrote the script and carried on to the $1,800 area.
So my original Elliott wave count was in serious jeopardy, but not yet dead in the water.
But since Monday's $1,796 high, the market has fallen back, and now I believe I can count on my count!
Here's why I'm bearish on gold
But first, let's back up and look at the long-term picture of the incredible rally continuation over the past year, and the subsequent topping process.
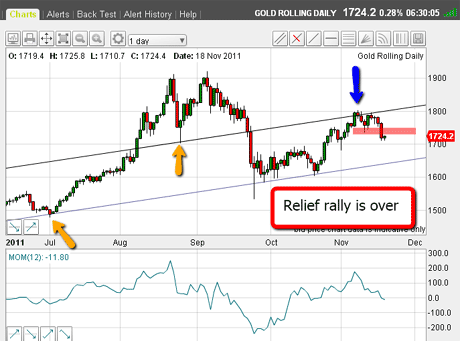
Here is the daily chart:

(Click on the chart for a larger version)
I have been calling the two peaks at the $1,920 level a 'double top' since the last one was put in on 6 September. It fulfills all of the correct guidelines according to classical technical analysis.
I have no reason to doubt that these tops mark the end of the multi-year bull market.
That has been my stance and I will only change my mind if the market can take out these highs. That is why I favour trading from the short side.
Also, we know that markets fall faster than they rise. As they say, "It takes longer to climb the stairs than to fall out of the window".
So where to now?
I can draw a fairly convincing tramline pair, I believe. Here's that chart again:

(Click on the chart for a larger version)
The anchor points (marked by the yellow arrows) establish their 'correct' positions. The latest rally to the $1,796 level just touches the upper tramline (marked by the blue arrow).
Right away, I suspected that this week's rally would end there. If not, it would punch right through and perhaps go on challenge the $1,920 top.
If that occurred, I would likely turn bullish!
But the market respected the tramline and began a sharp decline which gathered pace yesterday.
I have drawn in the support line (pink bar) which was broken yesterday, thus confirming the start of a new move down.
Trader tip: Look out for these minor support zones, but only after a strong run. Automatically setting sell-stops just below this zone to enter short trades is an excellent strategy, and I have found it eliminates the need to continually watch the market. It also imposes the necessary discipline, which we all need.
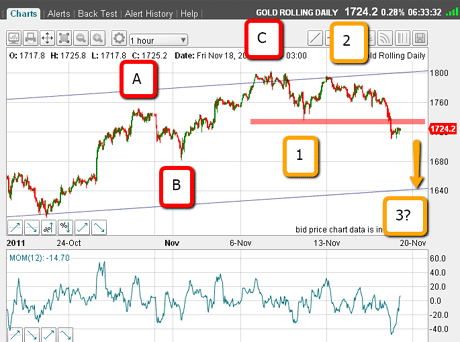
Also note the form of the relief rally off the early October plunge low. There are multiple A-B-C patterns, and these are always counter-main trend. Spotting one of these is usually confirmation that the main trend is going the other way.
Trader tip: Correctly identifying an A-B-C pattern keeps you aligned in the correct way, and often prevents you zigging while you should be zagging.
Here is the short-term chart showing the last A-B-C pattern off the 1 November low:

(Click on the chart for a larger version)
The important point to note is that because of yesterday's break of last Thursday's low, I can now count the Elliott waves with much more confidence.
That low becomes my new wave 1, the rally back to $1,796 is my wave 2, and now we are in a wave 3, which should be long and strong.
Could gold fall to $1,640?
As of this morning, I am expecting to see a rapid drop, but where is my main target?
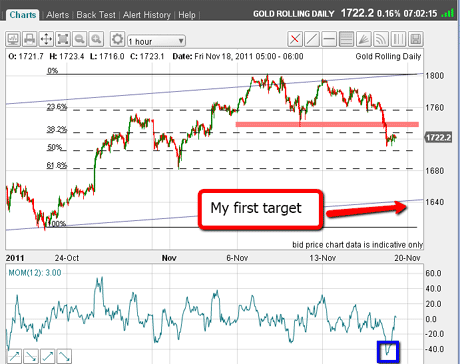
Remember the first chart with my lower tramline?

(Click on the chart for a larger version)
This tramline passes through the $1,640 area and that is my main target. If it reaches it within a few days, that would certainly qualify for a long and strong third wave!
But first, we will get a bounce off the oversold momentum reading, marked by the blue box. That would be a great opportunity for late-comers to take short positions.
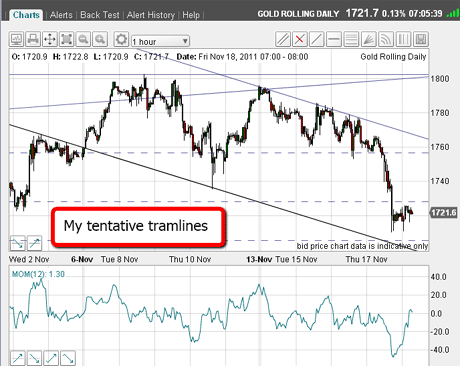
OK, we have a good-sized decline off the highs, so let's see if I can draw any down-sloping tramlines:

(Click on the chart for a larger version)
Indeed I can, but at this early stage, they are tentative, since I have only a few touch-points. But the ones I have are good.
I have also drawn in the Fibonacci levels and as I write, the market is trading between two Fibonacci levels, not having quite reached the 50% level.
Because gold can move very quickly, my strategy will be to try to catch the sharp rallies to add to positions.
However, this weekend could be crucial in all markets, as pressure is growing intense for Germany to capitulate and bail out most of the other eurozone countries, a move it has been resisting.
Dramatic developments often occur over the weekend when markets are closed. We could well see such an event this weekend.
That is why I will lighten up positions before the close, or even hedge. But that is a subject for another day.
If you're a new reader, or need a reminder about some of the methods I refer to in my trades, then do have a look at my introductory videos:
Advanced trading with Elliott waves
An introduction to Elliott wave theory
The essentials of tramline trading
Don't miss my next trading insight. To receive all my spread betting blog posts by email, as soon as I've written them, just sign up here .
Get the latest financial news, insights and expert analysis from our award-winning MoneyWeek team, to help you understand what really matters when it comes to your finances.
John is is a British-born lapsed PhD physicist, who previously worked for Nasa on the Mars exploration team. He is a former commodity trading advisor with the US Commodities Futures Trading Commission, and worked in a boutique futures house in California in the 1980s.
He was a partner in one of the first futures newsletter advisory services, based in Washington DC, specialising in pork bellies and currencies. John is primarily a chart-reading trader, having cut his trading teeth in the days before PCs.
As well as his work in the financial world, he has launched, run and sold several 'real' businesses producing 'real' products.
-
 Average UK house price reaches £300,000 for first time, Halifax says
While the average house price has topped £300k, regional disparities still remain, Halifax finds.
-
 Barings Emerging Europe trust bounces back from Russia woes
Barings Emerging Europe trust has added the Middle East and Africa to its mandate, delivering a strong recovery, says Max King