Gold looks like it's heading lower
The price of gold looks like it is set to head down, says John C Burford. There could be some terrific opportunities ahead for short traders.
Get the latest financial news, insights and expert analysis from our award-winning MoneyWeek team, to help you understand what really matters when it comes to your finances.
You are now subscribed
Your newsletter sign-up was successful
Want to add more newsletters?

Twice daily
MoneyWeek
Get the latest financial news, insights and expert analysis from our award-winning MoneyWeek team, to help you understand what really matters when it comes to your finances.

Four times a week
Look After My Bills
Sign up to our free money-saving newsletter, filled with the latest news and expert advice to help you find the best tips and deals for managing your bills. Start saving today!
Yesterday's market action was tumultuous with just about everything falling.
All 30 of the Dow Jones Industrials were down, and 499 of the stocks on the S&P 500 closed lower.
How's that for an emphatic down day?
MoneyWeek
Subscribe to MoneyWeek today and get your first six magazine issues absolutely FREE

Sign up to Money Morning
Don't miss the latest investment and personal finances news, market analysis, plus money-saving tips with our free twice-daily newsletter
Don't miss the latest investment and personal finances news, market analysis, plus money-saving tips with our free twice-daily newsletter
Because of the massive change in market sentiment yesterday, I will follow up yesterday's gold coverage with a brief note and then get to cover the euro tomorrow.
I have a feeling I will not have a shortage of material to work with.
OK, yesterday, I laid out my case for the relief rally top in gold having been put in on Tuesday at $1,800 an ounce. Since writing that, I have had solid confirmation.
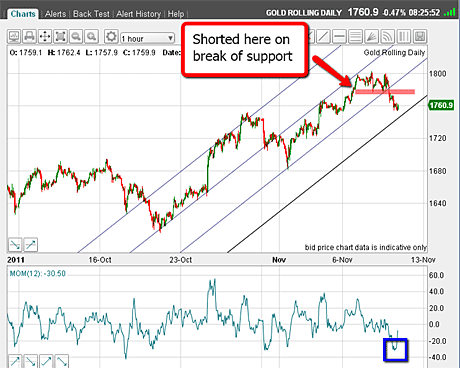
Here is the latest hourly chart:

(Click on the chart for a larger version)
The market did move down through the support (marked by the purple bar) at the $1,780 area and short trades were touched. I am now short.
At the same time, the market moved below the tramline and is now heading for my fourth tramline in the $1,750 area.
This is a wonderful example of how to use multiple tramlines to forecast price and time targets. (If you haven't seen my video tutorials on my tramline trading methods, watch them here).
But note the oversold momentum reading. This is a warning sign to expect a possible bounce.
This potential bounce may or may not be large. It could take the form of a narrow congestion zone between current levels and perhaps the $1,775 area, as the market attempts to push to the underside of the next higher tramline.
That would present short selling traders with a terrific opportunity to enter positions.
But with stock markets and currencies suffering hammer blows as the flight-to-cash gains momentum, I am not sure that gold can manage much of a bounce at all.
With yesterday's downside action being so emphatic, my Elliott wave analysis of yesterday is looking good. I am expecting much lower prices just ahead in a large wave 3 formation.
If you're a new reader, or need a reminder about some of the methods I refer to in my trades, then do have a look at my introductory videos:
The essentials of tramline trading
An introduction to Elliott wave theory
Don't miss my next trading insight. To receive all my spread betting blog posts by email, as soon as I've written them, just sign up here .
Get the latest financial news, insights and expert analysis from our award-winning MoneyWeek team, to help you understand what really matters when it comes to your finances.
John is is a British-born lapsed PhD physicist, who previously worked for Nasa on the Mars exploration team. He is a former commodity trading advisor with the US Commodities Futures Trading Commission, and worked in a boutique futures house in California in the 1980s.
He was a partner in one of the first futures newsletter advisory services, based in Washington DC, specialising in pork bellies and currencies. John is primarily a chart-reading trader, having cut his trading teeth in the days before PCs.
As well as his work in the financial world, he has launched, run and sold several 'real' businesses producing 'real' products.
-
 Average UK house price reaches £300,000 for first time, Halifax says
While the average house price has topped £300k, regional disparities still remain, Halifax finds.
-
 Barings Emerging Europe trust bounces back from Russia woes
Barings Emerging Europe trust has added the Middle East and Africa to its mandate, delivering a strong recovery, says Max King