Is the Dow due a bounce?
With the Dow in a downward trend over the last few days, the market is due a bounce - but how high will it go? John C Burford looks to the charts for a clue.
Get the latest financial news, insights and expert analysis from our award-winning MoneyWeek team, to help you understand what really matters when it comes to your finances.
You are now subscribed
Your newsletter sign-up was successful
Want to add more newsletters?

Twice daily
MoneyWeek
Get the latest financial news, insights and expert analysis from our award-winning MoneyWeek team, to help you understand what really matters when it comes to your finances.

Four times a week
Look After My Bills
Sign up to our free money-saving newsletter, filled with the latest news and expert advice to help you find the best tips and deals for managing your bills. Start saving today!
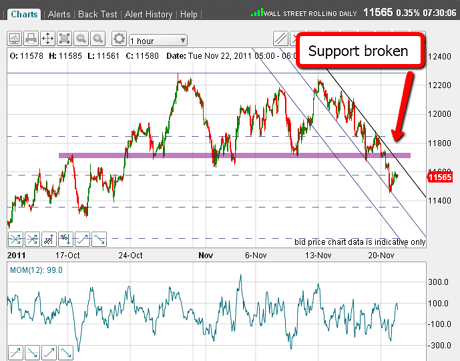
I thought I'd write a short follow-up to yesterday's post, when the market was attempting to challenge chart support in the 11,700 region.

Yesterday's trading saw a major development - the market broke decisively down through this support and is currently heading for my other major target the Fibonacci 50% retrace at the 11,350 area.
But first, I believe we shall see a decent bounce. Why do I say that?
MoneyWeek
Subscribe to MoneyWeek today and get your first six magazine issues absolutely FREE

Sign up to Money Morning
Don't miss the latest investment and personal finances news, market analysis, plus money-saving tips with our free twice-daily newsletter
Don't miss the latest investment and personal finances news, market analysis, plus money-saving tips with our free twice-daily newsletter
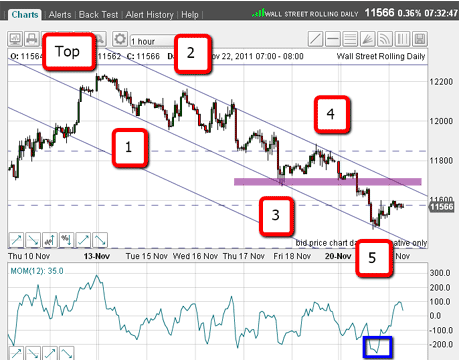
Well, not only are we working our way down through support provided by the congestion zone from mid-October, but we seem to have completed a minor Elliott wave five-wave pattern:

(Click on the chart for a larger version)
From the 13 November high, I can count five waves down all contained within a nice pair of tramlines. The final fifth wave landed right on my lower tramline and overshot the Fibonacci 38% level into the bargain.
And the fifth wave created an oversold momentum reading (highlighted by the blue box).
The appearance of this completed five wave pattern means that the larger trend is now down.
But by now, we all must know what comes after a completed five wave pattern a corrective upward relief rally, usually in an A-B-C format.
So I am expecting a decent rally from here.
How high will the Dow bounce?
How far up is it likely to reach? Typically, when a significant support zone has been breached, we see a pull-back at least to this area (marked by the purple bar).
This upcoming rally may or may not take it over the upper tramline. But if I see a clear A-B-C pattern, I shall be ready to short the market again as close to the C wave top as possible.
Naturally, short-term traders would have been looking to cover their short trades near the fifth wave low and then look to re-establish on the rally.
Tomorrow I shall cover gold, which appears to be following my script nicely and is giving an object lesson in trading using Elliott waves and Fibonacci retracements.
If you're a new reader, or need a reminder about some of the methods I refer to in my trades, then do have a look at my introductory videos:
Advanced trading with Elliott waves
An introduction to Elliott wave theory
The essentials of tramline trading
Don't miss my next trading insight. To receive all my spread betting blog posts by email, as soon as I've written them, just sign up here .
Get the latest financial news, insights and expert analysis from our award-winning MoneyWeek team, to help you understand what really matters when it comes to your finances.
John is is a British-born lapsed PhD physicist, who previously worked for Nasa on the Mars exploration team. He is a former commodity trading advisor with the US Commodities Futures Trading Commission, and worked in a boutique futures house in California in the 1980s.
He was a partner in one of the first futures newsletter advisory services, based in Washington DC, specialising in pork bellies and currencies. John is primarily a chart-reading trader, having cut his trading teeth in the days before PCs.
As well as his work in the financial world, he has launched, run and sold several 'real' businesses producing 'real' products.
-
 MoneyWeek Talks: The funds to choose in 2026
Podcast Fidelity's Tom Stevenson reveals his top three funds for 2026 for your ISA or self-invested personal pension
-
 Three companies with deep economic moats to buy now
Opinion An economic moat can underpin a company's future returns. Here, Imran Sattar, portfolio manager at Edinburgh Investment Trust, selects three stocks to buy now