Trading when stock markets go both ways
Unlike the FTSE 100, the Nasdaq has continued to make new highs. John C Burford explains what this classic risk-on phenomenon says about market sentiment.
Get the latest financial news, insights and expert analysis from our award-winning MoneyWeek team, to help you understand what really matters when it comes to your finances.
You are now subscribed
Your newsletter sign-up was successful
Want to add more newsletters?

Twice daily
MoneyWeek
Get the latest financial news, insights and expert analysis from our award-winning MoneyWeek team, to help you understand what really matters when it comes to your finances.

Four times a week
Look After My Bills
Sign up to our free money-saving newsletter, filled with the latest news and expert advice to help you find the best tips and deals for managing your bills. Start saving today!
This week, major stock markets have been powering higher. Some markets have even reached new all-time highs. But not the FTSE 100.
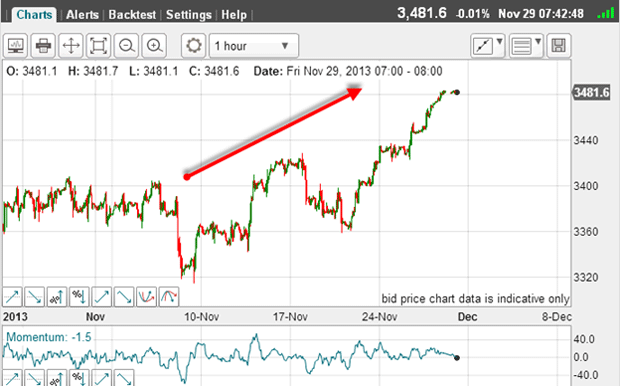
As a measure of bullish enthusiasm for tech stocks, here is the Nasdaq:
On Monday, this was the picture on the hourly chart for the FTSE 100:
MoneyWeek
Subscribe to MoneyWeek today and get your first six magazine issues absolutely FREE

Sign up to Money Morning
Don't miss the latest investment and personal finances news, market analysis, plus money-saving tips with our free twice-daily newsletter
Don't miss the latest investment and personal finances news, market analysis, plus money-saving tips with our free twice-daily newsletter
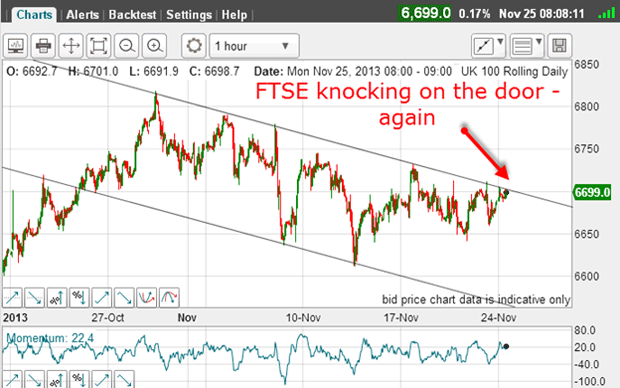
And this is the position this morning:
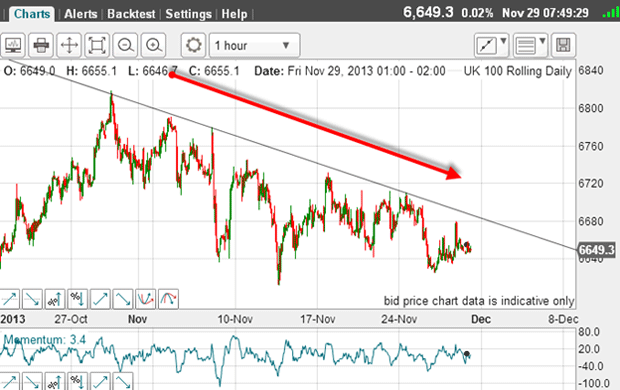
The FTSE 100 made its high on 30 October one month ago. Since then, the Nasdaq has made a succession of new highs.
This is a very large divergence and it clearly indicates that the bulls are neglecting the solid dividend-paying global companies in the FTSE 100. Instead, they are favouring the riskier, younger US tech stocks in the Nasdaq.
This is a classic risk-on phenomenon. And it is worth noting that it comes after a nearly five-year bull run.
The bigger picture
As I mentioned on Wednesday, it is a good idea to put the current moves in perspective by constantly referring to the bigger picture.
This is the daily chart going back two years:
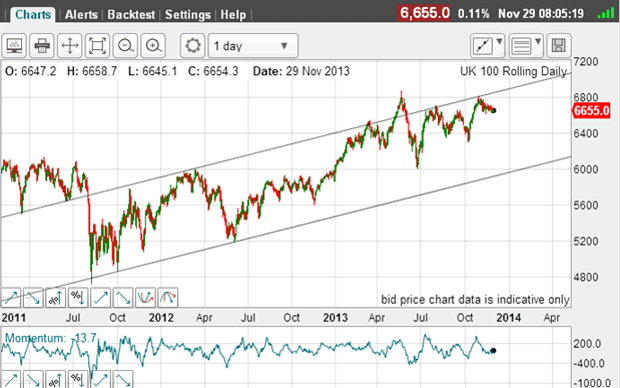
I have drawn in a very good tramline pair with my upper line having two great PPPs (prior pivot points) and at least six touch points.
There is also the little matter of the spike move above the line in May. That can be ignored for now, because there are so many good touch points. And, with the exception of this spike, there has been no trading above the line in well over two years.
This line therefore represents solid resistance. Any rally to this tramline is likely to be met with strong resistance.
My lower tramline has three good touch points, making the pair reliable.
The most recent hit on the upper tramline was at the 30 October high of 6,818. It was then knocked back, which confirmed the tramline as solid resistance.
And with the 30 October hit on the upper tramline, this sets up the possibility of a genuine double top, as I explained in my 20 November post.
Now, with the market trading 150 points below this high, will the market gird up its loins and make another assault on the line?
Respected lines of resistance and support
Of course, one reason the FTSE is lagging the Nasdaq is the strength of GBP/USD, which has gained in the last month. So let's compare the FTSE 100 with a more risky' UK index the FTSE 250 mid-caps.
This is the hourly chart over the past month or so:
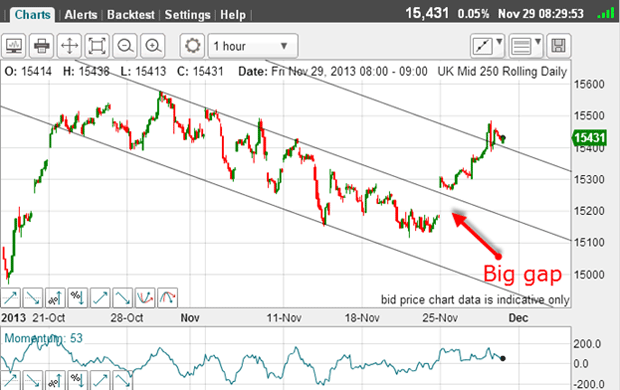
The zig-zag decline off the 30 October high was contained by my tramlines, like it was in the FTSE 100 chart. But on Monday, the market leaped up over the upper tramline in a large gap. This is short-term bullish behaviour.
Yet this action was not replicated in the FTSE 100.
This morning, the FTSE 250 has reached my upper tramline (a price target) and is currently deciding what to do now. Meanwhile, the FTSE 100 has not even broken above the upper tramline, and is lagging badly.
Something has to give. But the point is that tramlines are there to be respected as lines of resistance and support, and you can use them with confidence.
Get the latest financial news, insights and expert analysis from our award-winning MoneyWeek team, to help you understand what really matters when it comes to your finances.
John is is a British-born lapsed PhD physicist, who previously worked for Nasa on the Mars exploration team. He is a former commodity trading advisor with the US Commodities Futures Trading Commission, and worked in a boutique futures house in California in the 1980s.
He was a partner in one of the first futures newsletter advisory services, based in Washington DC, specialising in pork bellies and currencies. John is primarily a chart-reading trader, having cut his trading teeth in the days before PCs.
As well as his work in the financial world, he has launched, run and sold several 'real' businesses producing 'real' products.
-
 Last chance to invest in VCTs? Here's what you need to know
Investors have pumped millions more into Venture Capital Trusts (VCTS) so far this tax year, but time is running out to take advantage of tax perks from them.
-
 ISA quiz: How much do you know about the tax wrapper?
Quiz One of the most efficient ways to keep your savings or investments free from tax is by putting them in an Individual Savings Account (ISA). How much do you know about ISAs?