Why traders need to look at the big picture
It's all too easy for swing traders to get bogged down in short-term details. John C Burford explains why it pays to keep an eye on the longer term charts.
Get the latest financial news, insights and expert analysis from our award-winning MoneyWeek team, to help you understand what really matters when it comes to your finances.
You are now subscribed
Your newsletter sign-up was successful
Want to add more newsletters?

Twice daily
MoneyWeek
Get the latest financial news, insights and expert analysis from our award-winning MoneyWeek team, to help you understand what really matters when it comes to your finances.

Four times a week
Look After My Bills
Sign up to our free money-saving newsletter, filled with the latest news and expert advice to help you find the best tips and deals for managing your bills. Start saving today!
As swing traders, we generally focus on the short-term charts. This is where we find clues as to a good trade entry and the next direction of the market.
There is nothing wrong with this approach, since we are typically dealing with moves of tens of pips. Also, we are using protective stops of a similar magnitude. These swings show up very well on the hourly chart.
But by doing only this, it becomes easy to lose sight of the bigger picture. That is, unless you make it a habit of regularly checking in on the daily and even the weekly charts. And you should especially be checking the monthly charts.
MoneyWeek
Subscribe to MoneyWeek today and get your first six magazine issues absolutely FREE

Sign up to Money Morning
Don't miss the latest investment and personal finances news, market analysis, plus money-saving tips with our free twice-daily newsletter
Don't miss the latest investment and personal finances news, market analysis, plus money-saving tips with our free twice-daily newsletter
The latter can give excellent insights as to when the market is turning. It is also instrumental when attempting to catch a trend change because it often allows us to get on board the new swing early in its development.
Yet this valuable source of information is often overlooked.
Finding the key reversal

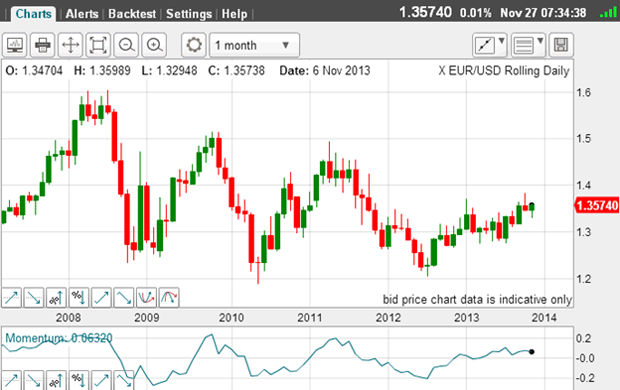
Do you see any repeating pattern at the highs in this chart?
At the tops of the waves, the top-most candle is red (with pigtails). This tells you that the market made a high in that month and closed lower than the previous month's close. Those occurred in 2008, 2009 and 2011.
Those are examples of the key reversal, which have been studied since the early days of technical analysis.
The general rule is that key reversals are more significant on the monthly and weekly charts than on the daily. They frequently appear at market tops, which can be seen here.
Now look at the most recent high two bars ago. It is a red bar with a pigtail, and therefore has the potential to be another key reversal. This signifies a change of trend from up to down. That is the first major piece of information we have gleaned.
How to confirm a trend
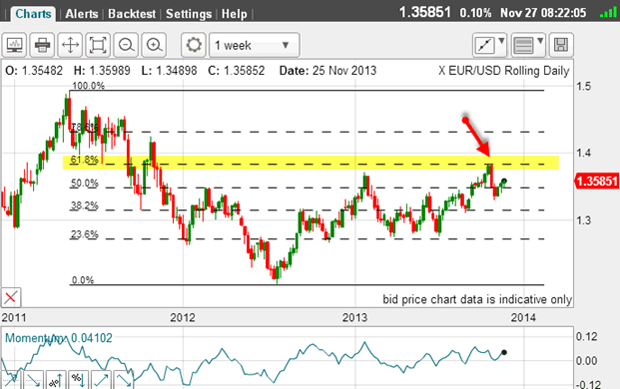
This is where the Fibonacci tool comes into its own, so let's find the most recent high and low and apply it:

On the weekly chart, I have used the 2011 high and the 2012 low as my pivot points. And lo and behold, the market has just retraced a Fibonacci 62% to the recent high.
Remember, the 50% and 62% levels are the most common turning points for wave retracements.
So this is another piece of evidence that there could be a trend-change operating. That makes two solid clues.
Now, is there anything else that can confirm this view?
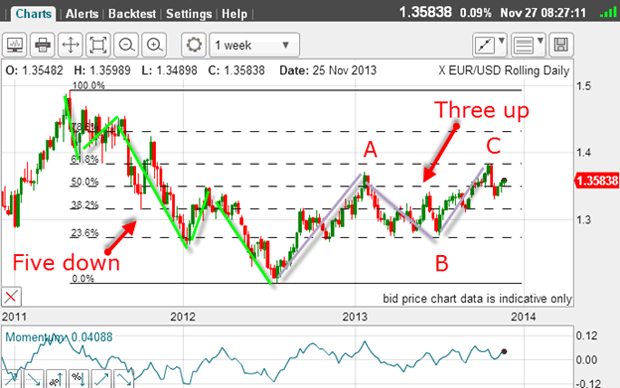
Yes there is, and it comes from an Elliott wave analysis of the waves:

On the weekly chart, there is a clear five-wave pattern from the 2011 high to the 2012 low. This means the one larger trend is down.
From that low, there is a clear three-wave A-B-C pattern to the recent high. Three waves up is counter-trend.
The Elliott wave structure thus indicates that a trend change is highly likely.
That makes three vital clues.
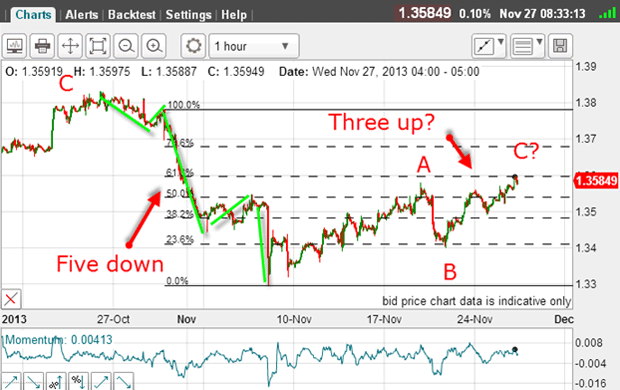
Now it's time to zoom in on the small-scale hourly chart:

From the wave C high, there is a clear five waves down, indicating the larger trend is down. That confirms our bearish picture so far.
And from the plunge low, there is a clear A-B-C form to the rally, which is counter-trend.
Not only that, but my latest C wave has just hit the Fibonacci 62% retrace a common turning point.
Note that I have drawn in my Fibonacci levels from the second significant high off the C wave top. This may seem a little arbitrary, but you should explore all options for your pivot points, not just the absolute extreme price.
Now I have put together a picture that clearly is bearish.
How to get the odds in your favour
You see, no matter how strong our case and how convinced we are that we have found a ten-bagger or a home run, the market can always spring a surprise and defy our expectations. It happens quite frequently!
We are always dealing with probabilities when we trade never with certainties. And remember, when we short a market, someone is on the other side of the trade buying from us. Do they know something we don't? After all, that person wouldn't be buying if they agreed with our bearish analysis.
Also, although my analysis is bearish, the market could rally further and still give me a bearish picture. Any trade could be stopped on this rally, even though my analysis could be proved correct in time.
It is possible to be right and still lose money. But it is possible to be wrong and lose. This essentially means that there is only a 25% chance of being right and in profit!
It's a cruel place to be, unless you have adopted the correct attitude, where protection of capital and a sensible stop-loss policy are vital. I have my 3% rule for just this purpose.
The other major issue is this: how do you manage the trade once in? Some may take an early profit, and others may see it go into profit and then reverse through the stop for a loss.
In fact, trade entry is easy, but the exit is much more difficult. That is why it is a good idea to have a rule for your exits that you apply every time.
But over time, analysing the markets in this way can put the odds on your side.
Get the latest financial news, insights and expert analysis from our award-winning MoneyWeek team, to help you understand what really matters when it comes to your finances.
John is is a British-born lapsed PhD physicist, who previously worked for Nasa on the Mars exploration team. He is a former commodity trading advisor with the US Commodities Futures Trading Commission, and worked in a boutique futures house in California in the 1980s.
He was a partner in one of the first futures newsletter advisory services, based in Washington DC, specialising in pork bellies and currencies. John is primarily a chart-reading trader, having cut his trading teeth in the days before PCs.
As well as his work in the financial world, he has launched, run and sold several 'real' businesses producing 'real' products.
-
 Pitch to Portfolio: Lioness Jill Scott's investing game plan
Podcast After bringing football home as a Lioness, Jill Scott discusses how she transformed her finances and became an investor in this latest episode of MoneyWeek Talks.
-
 UK unemployment hits highest level since 2021 – will interest rate cuts follow?
UK unemployment reached its highest rate in almost five years by the end of 2025. Is AI to blame and will the Bank of England step in with an interest rate cut in March?