There’s unusual activity in the gold market
John C Burford identifies a telling pattern in the gold charts, and uses his 'split-bet' strategy to line up his next trade.
Get the latest financial news, insights and expert analysis from our award-winning MoneyWeek team, to help you understand what really matters when it comes to your finances.
You are now subscribed
Your newsletter sign-up was successful
Want to add more newsletters?

Twice daily
MoneyWeek
Get the latest financial news, insights and expert analysis from our award-winning MoneyWeek team, to help you understand what really matters when it comes to your finances.

Four times a week
Look After My Bills
Sign up to our free money-saving newsletter, filled with the latest news and expert advice to help you find the best tips and deals for managing your bills. Start saving today!
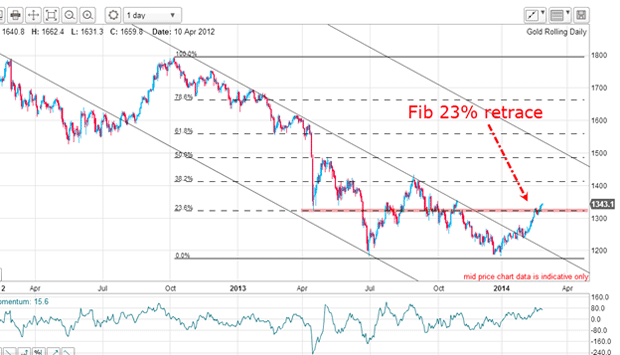
The gold rally continues. In my last post about gold on 17 February, the market had broken up out of a major tramline on the daily chart, giving a solid buy signal. That break occurred about $100 below the current market. Anyone who was following my tramline trading rule would now be in considerable profit.
After the break, the market went on to test and then close the open gap from last year.
It also made it to the Fibonacci 23% retrace of the large wave down off the October 2012 high in the $1,320 area. This is the daily chart as of this morning:
MoneyWeek
Subscribe to MoneyWeek today and get your first six magazine issues absolutely FREE

Sign up to Money Morning
Don't miss the latest investment and personal finances news, market analysis, plus money-saving tips with our free twice-daily newsletter
Don't miss the latest investment and personal finances news, market analysis, plus money-saving tips with our free twice-daily newsletter

The market now appears to be pulling away from the 23% level, where it had briefly paused. Because the market was at an important Fibonacci level, it had the option of reversing down from there.
This is a special pattern that I have found often gives an accurate indication of the next move, which makes it a useful trading tool.
In the example I'm giving you today, short-term traders would be faced with a dilemma. The style of trading used in this example involves a quick hit-and-run exit when specific targets are reached.
They are prepared to give up any further gains which could accrue by simply adopting the swing traders' approach. This approach is to stay with a trend until there are solid signs it has likely ended.
But entering a trade is the easy part. It is the management of the trade that is by far the most difficult aspect of trading. So to give you the best of both worlds, I'm going to show you why I advocate my 'split-bet strategy'.
How to get the best of both trading worlds

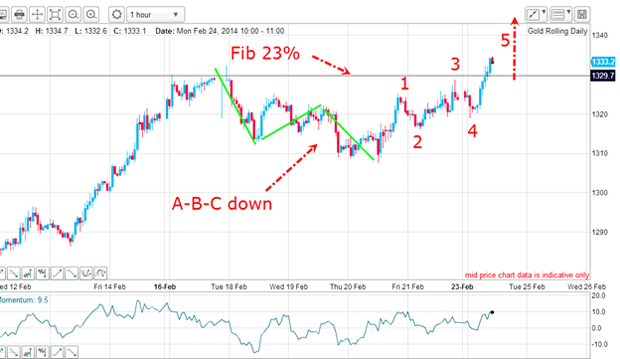
Last week, the market was engaged in the A-B-C correction (main trend still up). And starting last Friday, the market resumed its main uptrend making the zig-zag pattern I have labeled with the numbered waves.
This is my 5-wave continuation pattern, which I discovered some years ago. The pattern consists of five waves with these rules:
Wave 4 must overlap wave 1. And to confirm the pattern, wave 5 must exceed wave 3.
Waves 2, 3 and 4 must be of approximate equal size with the time duration of waves 2 and 4 about equal.
This is a textbook example of this pattern. It is as if the market is getting ready for another leg up.
When wave 5 rallied above wave 3, that was my signal the uptrend was intact.
Be careful not to confuse the five-wave continuation pattern with the five-wave Elliott wave pattern! My continuation pattern is a completely different beast with opposite implications. The Elliott wave five-wave pattern is a finishing structure, while my pattern implies a continuation of the trend.
Is the market about to make a sharp move up?

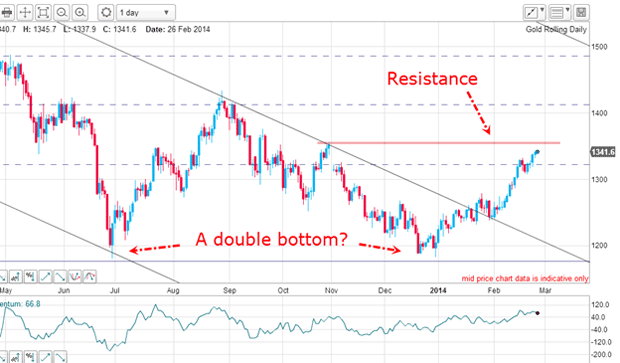
The major lows still stand out as a potential double bottom. And this interpretation implies a very large rally phase to at least the August 2013 high above $1,400. My third upper tramline in the top right corner is another potential target.
There are many hurdles along the way and the first is the October high just up ahead (my pink bar). There are likely to be masses of buy-stops here. That means the odds are high that professionals will gun for them.
Taking out stops (called running the stops') is a popular sport among some professional traders, especially in the gold and silver futures markets. These markets trade in relatively small volumes compared with the currency markets.
But the market is in a steep uptrend with no major setback (yet). This is a rare event and at some stage, we will see such a dip.
It will be interesting to see if the market can make that leap to my pink bar on this leg. If it does, then I believe we could see the market make a sharp move up. It'll move back down as the pros take their profits.
This is proving to be a very unusual gold market. And it may be telling us something about the state of the global economies.
Get the latest financial news, insights and expert analysis from our award-winning MoneyWeek team, to help you understand what really matters when it comes to your finances.
John is is a British-born lapsed PhD physicist, who previously worked for Nasa on the Mars exploration team. He is a former commodity trading advisor with the US Commodities Futures Trading Commission, and worked in a boutique futures house in California in the 1980s.
He was a partner in one of the first futures newsletter advisory services, based in Washington DC, specialising in pork bellies and currencies. John is primarily a chart-reading trader, having cut his trading teeth in the days before PCs.
As well as his work in the financial world, he has launched, run and sold several 'real' businesses producing 'real' products.
-
 ISA fund and trust picks for every type of investor – which could work for you?
Whether you’re an ISA investor seeking reliable returns, looking to add a bit more risk to your portfolio or are new to investing, MoneyWeek asked the experts for funds and investment trusts you could consider in 2026
-
 The most popular fund sectors of 2025 as investor outflows continue
It was another difficult year for fund inflows but there are signs that investors are returning to the financial markets