The euro is following my script
A disciplined use of charting methods is all you need to know which way the market will turn, says John C Burford. Here, he surveys the charts to see what's in store for the euro.
Get the latest financial news, insights and expert analysis from our award-winning MoneyWeek team, to help you understand what really matters when it comes to your finances.
You are now subscribed
Your newsletter sign-up was successful
Want to add more newsletters?

Twice daily
MoneyWeek
Get the latest financial news, insights and expert analysis from our award-winning MoneyWeek team, to help you understand what really matters when it comes to your finances.

Four times a week
Look After My Bills
Sign up to our free money-saving newsletter, filled with the latest news and expert advice to help you find the best tips and deals for managing your bills. Start saving today!
Since I last covered the euro on the3 May,we have seen some interesting developments. Last week, the European Central Bank(ECB) lowered its policy rate from 0.75% to 0.5%, and the euro barely budged on the news.
Maybe all of the big players discounted this earlier, with perhaps a nod and a wink from the ECB that they were planning such a move.
We small fries do not get tips' if they exist at all. We have to be smarter than the average banker.
MoneyWeek
Subscribe to MoneyWeek today and get your first six magazine issues absolutely FREE

Sign up to Money Morning
Don't miss the latest investment and personal finances news, market analysis, plus money-saving tips with our free twice-daily newsletter
Don't miss the latest investment and personal finances news, market analysis, plus money-saving tips with our free twice-daily newsletter
And this is where sensible use of my trading tools comes into play. Last time, I was expecting an extension of the rally taking place.
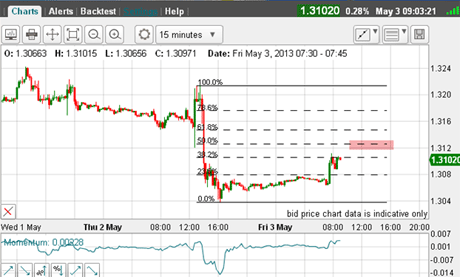
This was the chart then:
(Click on the chart for a larger version)
And I wrote: "And as I write, the rally has carried to the 38% level and appears to be stalling. This rally has an A-B-C feel to it, so the relief rally could be complete here.
"Ideally though, the rally would carry to the 50% level above 1.3120, where a trade could be entered. Based on my analysis, the 62% level is also a potential turning point."
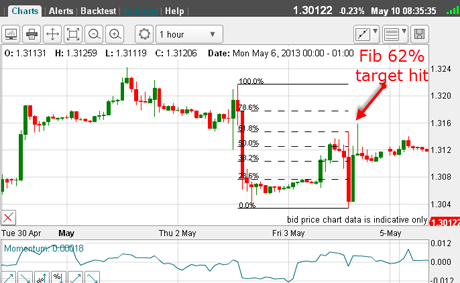
And sure enough, I got my rally extension right to my Fibonacci 62% level:
(Click on the chart for a larger version)
I was waiting there with a short trade.
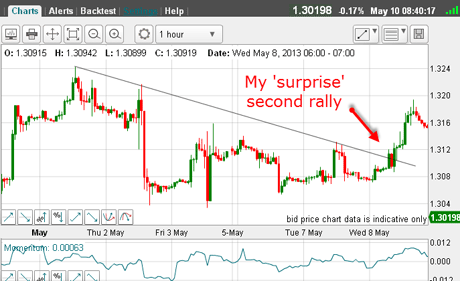
At that point, it looked as if the relief rally had been exhausted and my awaited downturn was in the offing. But, as so often happens, the market sprung a surprise it rallied once more:
(Click on the chart for a larger version)
It broke above my trendline, but only to the 1.3220 level. Since my protective stop was above this level, I was still holding my short.
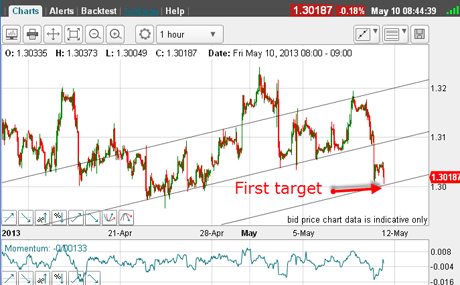
And following that rally which was totally counter-intuitive following the interest rate reduction the market saw reason and began a sharp decline. This is the position this morning:
(Click on the chart for a larger version)
The market fell heavily yesterday though my centre tramline, which was another signal for a short trade, of course.
I have a respectable upper tramline with many good tough points, so that I am able to draw in my lower tramline equidistant. And as I write, the market has hit the 1.30 level on the tramline target. Naturally, this is a good place for short-term traders to take profits.
This is a good place to look at the longer-range picture to keep us on the right track:
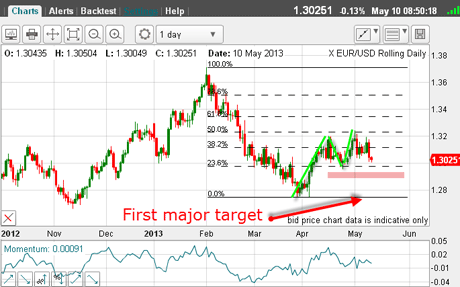
Using Elliot waves to find a long term target
Added confirmation is that there is a large negative-momentum divergence between the C and A wave tops.
With short-term support having given way, the next target is the late April 1.2950 low. If the market can move down to the pink bar, then the next target becomes the 1.2750 low.
But what are the near-term options? Here is the 15-minute chart this morning:
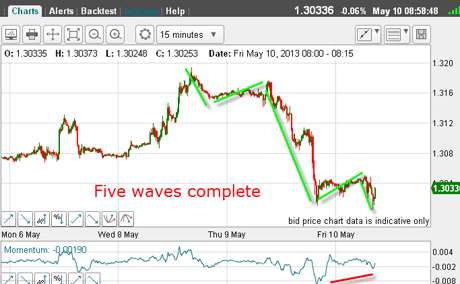
(Click on the chart for a larger version)
From the 1.32 high, I can count five complete Elliott waves. And with a large positive-momentum divergence at the fifth wave low (red bar). Time for a counter-trend rally, methinks.
And this evidence gives added weight to the notion of taking short-term profits I mentioned above.
So, just looking at the chart I am expecting a counter-trend rally. It may not start from here, although odds do favour this interpretation. And a rally above the minor high of this morning would confirm the rally was under way.
This is why I will be applying my Fibonacci levels to the probable rally once I can lock on to the low pivot point. As before, I shall be looking at the 50% and 62% levels for trading guidance.
So really, a trader does not need to have inside tips to make profits, just a disciplined use of my simple trading techniques.
If you're a new reader, or need a reminder about some of the methods I refer to in my trades, then do have a look at my introductory videos:
The essentials of tramline trading Advanced tramline trading An introduction to Elliott wave theory Advanced trading with Elliott waves Trading with Fibonacci levels Trading with 'momentum' Putting it all together
Don't miss my next trading insight. To receive all my spread betting blog posts by email, as soon as I've written them, just sign up here. If you have any queries regarding MoneyWeek Trader, please contact us here.
Get the latest financial news, insights and expert analysis from our award-winning MoneyWeek team, to help you understand what really matters when it comes to your finances.
John is is a British-born lapsed PhD physicist, who previously worked for Nasa on the Mars exploration team. He is a former commodity trading advisor with the US Commodities Futures Trading Commission, and worked in a boutique futures house in California in the 1980s.
He was a partner in one of the first futures newsletter advisory services, based in Washington DC, specialising in pork bellies and currencies. John is primarily a chart-reading trader, having cut his trading teeth in the days before PCs.
As well as his work in the financial world, he has launched, run and sold several 'real' businesses producing 'real' products.
-
 Japanese stocks rise on Takaichi’s snap election landslide
Japan’s new prime minister Sanae Takaichi has won a landslide victory in a snap election, prompting optimism that her pro-growth agenda will benefit Japanese stocks
-
 Alphabet 'is planning a 100-year bond': would you back Google for 100 years?
Google owner Alphabet is reported to be joining the rare century bond club
-
 Investors dash into the US dollar
News The value of the US dollar has soared as investors pile in. The euro has hit parity, while the Japanese yen and the Swedish krona have fared even worse.
-
 Could a stronger euro bring relief to global markets?
Analysis The European Central Bank is set to end its negative interest rate policy. That should bring some relief to markets, says John Stepek. Here’s why.
-
 A weakening US dollar is good news for markets – but will it continue?
Opinion The US dollar – the most important currency in the world – is on the slide. And that's good news for the stockmarket rally. John Stepek looks at what could derail things.
-
 How the US dollar standard is now suffocating the global economy
News In times of crisis, everyone wants cash. But not just any cash – they want the US dollar. John Stepek explains why the rush for dollars is putting a big dent in an already fragile global economy.
-
 The pound could hit parity with the euro – but if it does, buy it
Features Anyone visiting the continent this summer will have been in for a rude shock at the cash till, says Dominic Frisby. But the pound won't stay down forever.
-
Gold’s rally should continue
Features Matthew Partridge looks at where the gold price is heading next, and what that means for your online trading.
-
 Prudent trades in Prudential
Features John C Burford shows how his trading methods can be used for more than just indices and currencies. They work for large-cap shares too.
-
 Did you find the path of least resistance in EUR/USD?
Features John C Burford outlines a trade in the euro vs the dollar in the wake of the US Federal Reserve’s most recent announcement.