Tramline trading the oil market - the next phase
John C Burford explains how to line up promising trades in the oil markets using his 'tramline trading' method.
Get the latest financial news, insights and expert analysis from our award-winning MoneyWeek team, to help you understand what really matters when it comes to your finances.
You are now subscribed
Your newsletter sign-up was successful
Want to add more newsletters?

Twice daily
MoneyWeek
Get the latest financial news, insights and expert analysis from our award-winning MoneyWeek team, to help you understand what really matters when it comes to your finances.

Four times a week
Look After My Bills
Sign up to our free money-saving newsletter, filled with the latest news and expert advice to help you find the best tips and deals for managing your bills. Start saving today!
In my last post, I showed one way to use my tramline trading method, using an example from the crude oil market. I'd like to continue focusing on this market. When trading pushes through an existing tramline, you need to start looking for a new pair. I'll show you how to do so, even at the very early stages.
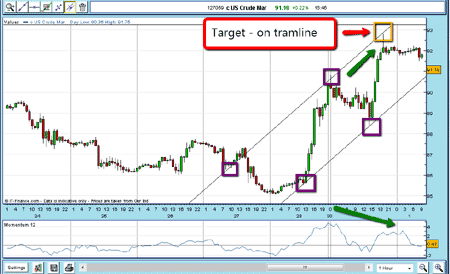
Recall the final chart from last time:

(Click on the chart for a larger version)
MoneyWeek
Subscribe to MoneyWeek today and get your first six magazine issues absolutely FREE

Sign up to Money Morning
Don't miss the latest investment and personal finances news, market analysis, plus money-saving tips with our free twice-daily newsletter
Don't miss the latest investment and personal finances news, market analysis, plus money-saving tips with our free twice-daily newsletter
The market spiked right up to my upper tramline (which was drawn long before it got there, please note). I did not give entry or exit points for possible trades, as I know traders have various methods for entering and exiting their trades. Some are able to watch market action in real time, and some are not. Others prefer to observe market action around potential entry/exit levels before making a trade, and will necessarily subject their trades to wider protective stops as they confirm the trend.
One further point about tramlines when drawing them in real time, their positions are, of course, speculative. I may not have them placed correctly. It's only with hindsight that I can say that they are correctly placed. The other point is that you need some leeway in drawing them the highs and lows rarely line up exactly on your straight line, and a 'best fit' is all we can expect.
But that applies to any and all trading methods. The point is that using these methods gives you likely areas to watch for potential turning points in the markets, and so can help you to line up promising trades. Trading is all about discipline. If you don't have a plan and a target for both your entry and your exit, then you are just flailing around in the dark. You might get lucky at times, but it'll only take a couple of big misjudgements to wipe out your capital. By following a clear strategy, you can pick the most promising trades, ride with them when they go right, and minimise your losses when they go wrong.
Back to the oil trade
OK, so I identified a valid pair of tramlines leading up to the 31 January spike high. Now what? If you are an active trader, who is happy to trade both long and short positions, you could look to sell short around the $92.50 level, and look to cover if the market gets near the extension of the lower tramline at the $91 area.
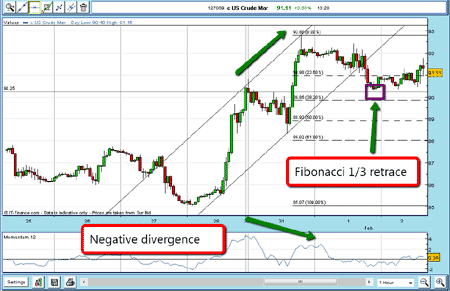
Let's have a look at how the market action panned out after this. Here is the hourly chart

(Click on the chart for a larger version)
On 1 February, the market did make it down (but in a very choppy way) to the lower tramline and made a breakthrough late in the day. I now had my low (at around $85 on 28 January) and my high (at $92.75 on 31 January). So I could now bring out my Fibonacci tool. The market fell to the Fibonacci retrace level (boxed out in purple above) and rebounded. Also, note the previous high of 31 January, which acted as support for the bounce.
Finding a new set of tramlines
Because my tramline had now been violated, I had to look for a new set.
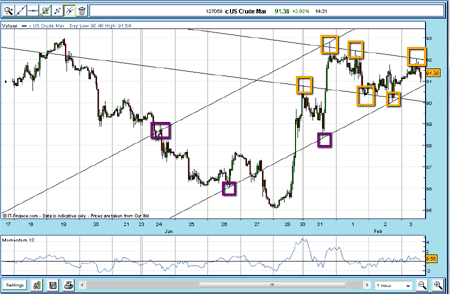
The next day 2 February the market swung up and down and spiked down to the $90 level, and then turned back up. This was a possible pivot point for a new tramline! You can see the result with the purple boxes on the left and the yellow boxes on the right. That gave me a lower tramline.
Now, where to set the upper one? Using my parallel line tool, I placed it right on our old friend, the spike on 31 January. It passes through the trading on 24 January not ideal, but a good working hypothesis (I'm talking now about the pair of rising tramlines in the chart below).

(Click on the chart for a larger version)
The market rallied off the 2 February low into the next day.
Now we have a problem that comes up with this method is the market in a bull market, taking it to new highs, or have we found the highs already?
The main evidence I use is to see if the market penetrates my new tramlines, or bounces off. Naturally, if all else is equal, I would look to buy if the lower tramline is approached, and short if the upper one is touched.
But look at what happens if I draw a tramline across the recent highs. I have three good touch points (yellow boxes) that is a good start. Using my parallel line tool, I can draw the lower line right through the 2 and 3 February lows and it passes through the 31 January high that is gratifying.
I can now rely on this new pair. If the market does rally off the up-trending tramline, it may well approach the upper down-trending tramline. That would be a good point to enter buy stops just above the $92 level to catch that move, if it were to occur.
What actually happened
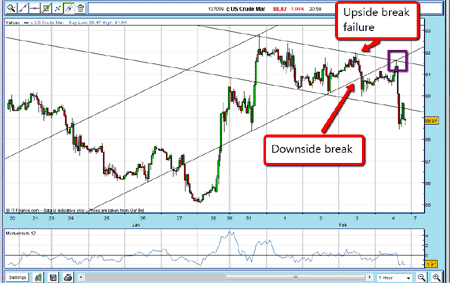
On 3 February, instead of pushing up through the $92 level, the market broke below my original tramline (see the point indicated as 'downside break' in the chart below). Now ordinarily, I would set a buy order at the line, expecting a bounce up.
But look at the form of the chart over the past four days. It shows a clear 'head and shoulders' pattern, and that made me cautious plus the failure at $92 (indicated below under 'upside break failure'). It was more likely that the tramline would be penetrated than bounce on 3 February, and I would set a sell order just under the line.

(Click on the chart for a larger version)
But look at the set-up. After trading lower, the market rallied on 4 February to the underside of the lower tramline (as indicated by the purple box). This is perfectly normal and should be expected any time a tramline is broken.
If you had shorted on 3 February at the $90.60 area, you may have been stopped out on the rally to $91.60 on 4 February. If so, you will see that this level is exactly where the down-sloping tramline meets my original up-sloping lower tramline (purple box)!
Remember, I drew these lines based on the highs and lows the market had put in (I had no hand in creating these points, I can assure you!) and the market seemed to just know where to stop and turn around.
During the rest of the day, the market collapsed. All during this time, there were sensible points to trade all based on simple tramline trading concepts.
Incidentally, as you can see from the way the second set of tramlines has been broken by the end of play on 4 February, I will now need to abandon my old sets of tramlines and look for new ones, based on the highs and lows the market creates over the days ahead.
NB: Don't miss my next bit of trading advice. To receive all my spread betting blog posts by email, as soon as I've written them, just sign up here .
Get the latest financial news, insights and expert analysis from our award-winning MoneyWeek team, to help you understand what really matters when it comes to your finances.
John is is a British-born lapsed PhD physicist, who previously worked for Nasa on the Mars exploration team. He is a former commodity trading advisor with the US Commodities Futures Trading Commission, and worked in a boutique futures house in California in the 1980s.
He was a partner in one of the first futures newsletter advisory services, based in Washington DC, specialising in pork bellies and currencies. John is primarily a chart-reading trader, having cut his trading teeth in the days before PCs.
As well as his work in the financial world, he has launched, run and sold several 'real' businesses producing 'real' products.
-
 Average UK house price reaches £300,000 for first time, Halifax says
While the average house price has topped £300k, regional disparities still remain, Halifax finds.
-
 Barings Emerging Europe trust bounces back from Russia woes
Barings Emerging Europe trust has added the Middle East and Africa to its mandate, delivering a strong recovery, says Max King