Hunting for trends in the oil market
When spread betting, having a strategy for entering and exiting the market is crucial if you want to be a successful trader. John C Burford shows how a simple pair of parallel lines can help.
Get the latest financial news, insights and expert analysis from our award-winning MoneyWeek team, to help you understand what really matters when it comes to your finances.
You are now subscribed
Your newsletter sign-up was successful
Want to add more newsletters?

Twice daily
MoneyWeek
Get the latest financial news, insights and expert analysis from our award-winning MoneyWeek team, to help you understand what really matters when it comes to your finances.

Four times a week
Look After My Bills
Sign up to our free money-saving newsletter, filled with the latest news and expert advice to help you find the best tips and deals for managing your bills. Start saving today!
I am always on the lookout for tramlines on my charts. Tramlines are simply parallel lines of support (on dips) and resistance (on rallies). I like to picture my charts as consisting of periods of trading between pretty well-defined tramlines. The lines act as mirrors that the market bounces off.
In several previous emails I have shown some impressive examples of tramlines at work.
Of course, trading between a particular pair of tramlines does not go on for ever. The market eventually moves out through one of the tramlines into perhaps another set.
MoneyWeek
Subscribe to MoneyWeek today and get your first six magazine issues absolutely FREE

Sign up to Money Morning
Don't miss the latest investment and personal finances news, market analysis, plus money-saving tips with our free twice-daily newsletter
Don't miss the latest investment and personal finances news, market analysis, plus money-saving tips with our free twice-daily newsletter
Their great virtue is that they give you a natural trade entry point and a natural place to set your protective stop. But to get the best results, you have to search them out early.
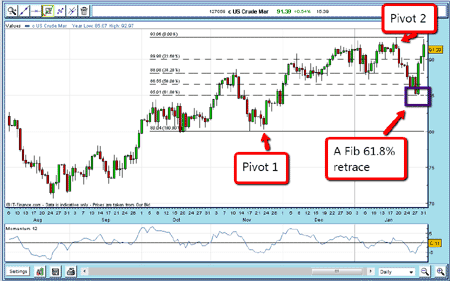
Recently, the crude oil market offered yet another great example. This is the daily chart showing the bull run from the summer:

(Click on the chart for a larger version)
The double lows at $80 a barrel in October and November provided the springboard for the sharp move to the recent high at $93 on 19 January. Note the momentum was getting weaker as the high was approached. That gave me a clue to expect at least a partial retracement, and when the market started dropping in late January, I could then apply my Fibonacci tool using the $80 low as my low pivot and the $93 high as my high pivot. (Incidentally, the other clue hinting at a top in this area, is that it represents the 50% retrace of the huge 2008 crash from $150 to the low $30s).
Where could I expect the decline to encounter any solid support? The Fibonacci 50% and 61.8% levels are often such stopping points. But I have another tool to help me my tramline method!
Using tramlines to find turning points
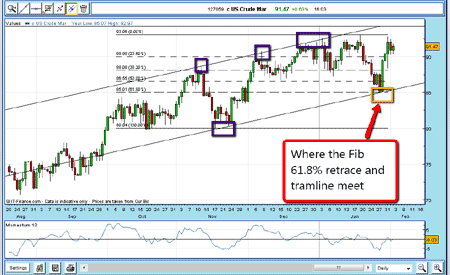
Applying my straight line tool to the tops (boxed out in purple on the chart below) I have three to four very good points. Using my parallel line tool, I apply it to pass through the 23 November low and find it passes right through the 61.8% Fibonacci level. How nice. This tramline has to be a great candidate for the upcoming low and it was, as we see outlined in the yellow box below.

(Click on the chart for a larger version)
Momentum at the $85 a barrel level is veering towards oversold (as you can see from the momentum line running below the chart above). So that would be a great place to go long, and to trade with the main trend. But how high will the market likely go, when it rallies? Let's look at the hourly chart:

(Click on the chart for a larger version)
How high could the market go?
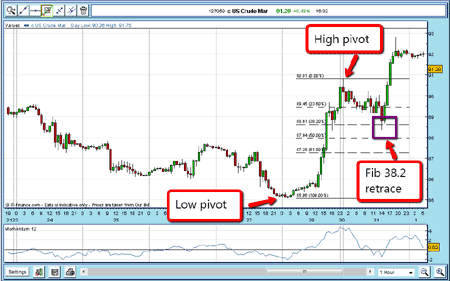
As the chart above shows, the market rallied very strongly off the 28 January low at $85 a barrel. The next trading day (31 January), the market started drifting down to correct the very overbought Momentum reading.
I could now apply my Fibonacci tool with my $85 low as pivot 1 and the $90.80 high (made on January 28) as my pivot 2. As the market drifted, it hit the 38.2% mark (the purple box above) and started to rally.
Can I expect the market to keep rallying past the pivot 2 (market 'high pivot' in the chart above)? Well, so far, there has only been one wave I would expect at least one more wave up, because more often than not, continuation patterns after a dip in a bull market show at least an A-B-C pattern sometimes a 1-2-3-4-5.
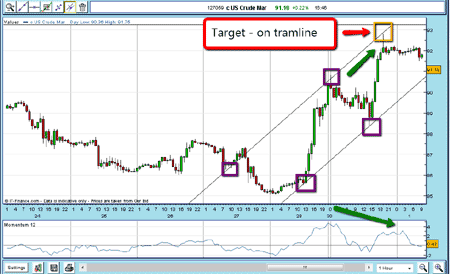
Later that day, the market made another strong push. Now I could draw new pair of tramlines. I have four good points (purple boxes) two on the upper and two on the lower.
That means I have a target right where the upper Tramline extends to! That makes the $92.75 level a good target (outlined in yellow below) to exit the trade.

(Click on the chart for a larger version)
If you'd entered near $86 a barrel on 28 January, that would be a profit of at least $5 taken. On a spreadbet of £1 a pip, that is £500 and made in two days.
NB: Don't miss my next bit of trading advice. To receive all my spread betting blog posts by email, as soon as I've written them, just sign up here .
Get the latest financial news, insights and expert analysis from our award-winning MoneyWeek team, to help you understand what really matters when it comes to your finances.
John is is a British-born lapsed PhD physicist, who previously worked for Nasa on the Mars exploration team. He is a former commodity trading advisor with the US Commodities Futures Trading Commission, and worked in a boutique futures house in California in the 1980s.
He was a partner in one of the first futures newsletter advisory services, based in Washington DC, specialising in pork bellies and currencies. John is primarily a chart-reading trader, having cut his trading teeth in the days before PCs.
As well as his work in the financial world, he has launched, run and sold several 'real' businesses producing 'real' products.
-
 Average UK house price reaches £300,000 for first time, Halifax says
While the average house price has topped £300k, regional disparities still remain, Halifax finds.
-
 Barings Emerging Europe trust bounces back from Russia woes
Barings Emerging Europe trust has added the Middle East and Africa to its mandate, delivering a strong recovery, says Max King