You are now subscribed
Your newsletter sign-up was successful
Want to add more newsletters?

Twice daily
MoneyWeek
Get the latest financial news, insights and expert analysis from our award-winning MoneyWeek team, to help you understand what really matters when it comes to your finances.

Four times a week
Look After My Bills
Sign up to our free money-saving newsletter, filled with the latest news and expert advice to help you find the best tips and deals for managing your bills. Start saving today!
I want to talk about gold today. But before I do, I just want to briefly follow up my note on the pound yesterday.
I outlined a textbook tramline setup for a low-risk short trade and stated my minimum target (from a tramline measurement) was 1.55. That level was hit and exceeded last night.
MoneyWeek
Subscribe to MoneyWeek today and get your first six magazine issues absolutely FREE

Sign up to Money Morning
Don't miss the latest investment and personal finances news, market analysis, plus money-saving tips with our free twice-daily newsletter
Don't miss the latest investment and personal finances news, market analysis, plus money-saving tips with our free twice-daily newsletter
I entered the trade on a previously-entered sell stop and simultaneously entered my protective buy-stop to limit my loss in case I was wrong.
This is a great way to trade, as it means you do not have to be glued to your screen constantly and who can stay sane doing that?
Also, by planning your trade in advance, you have time to allocate the size of your spread-bet rationally.
Gold is sliding as cash becomes king
OK, back to gold. On Monday. I set my downside targets at the $1,670 an ounce area and then the $1,600 area.
Since then, my first target has been breached, and the second is within range as I write. The market has declined by $135 since the spike $1,760 high made last Thursday.
This sharp drop has the gold bulls scratching their heads. With the turmoil in the eurozone currency and bond markets ramping up, they were expecting gold to rally as a safe haven.
But as I pointed out on Monday, in a full-blown economic crisis, there are precious few hiding places.
Cash is king in a deflationary environment.
It seems that now European central banks are unloading gold onto the market in a desperate bid to raise cash.
This theme of raising cash (dollars) to maintain debt interest payments will intensify, and is one core reason why I believe gold (and silver) will fail as a safe haven.
The move down from last Thursday's high is yet another classic example of an Elliott wave pattern. Here is the chart:
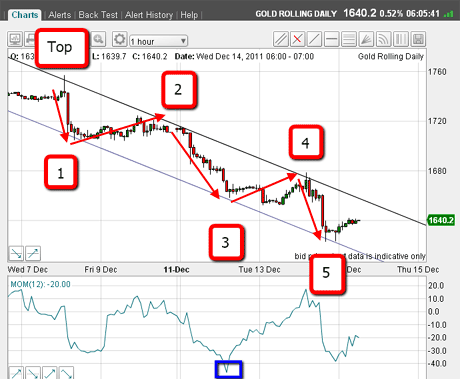
(Click on the chart for a larger version)
All of the typical signs of a completed impulsive (five waves) move are there:
Wave 2 (up, and counter-trend) contains a clear A-B-C pattern;
Wave 3 is 'long and strong' showing oversold momentum reading (marked by the blue box);
All of the waves are contained within my tramlines;
Wave 5 stops right on the lower tramline and sports a positive momentum divergence with that at wave 3.
Gold is set to rally
If you have been following my emails for a while, you will know what follows a completed impulse pattern a relief rally, usually in the form of an A-B-C pattern. That is what I will be looking for today.
Of course, this lovely five-wave impulse wave is part of larger patterns that are being played out. Its existence simply confirms that we are well into a bear market, where relief rallies are to be shorted into.
As you know, my first major downside target is the $1,600 area and here is the reason why:
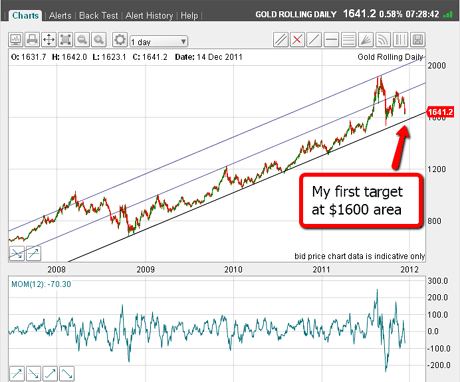
(Click on the chart for a larger version)
This is the daily chart from 2008 and shows my long-standing major tramlines.
The market has stayed within the lower pair for most of this time, and has only briefly spiked up to the upper pair as it made its blow-off double-top, that I have referred to several times in previous emails.
The market now is trading back within its customary tramline pair, having broken back below the central tramline. The market is heading for the lowest tramline. If it hits it, that will occur in the $1,600 area.
Note the wild momentum swings in recent weeks a classic sign of a major change of trend from the multi-year bull market to a bear market.
Patterns within patterns
Let's look at a close-up:
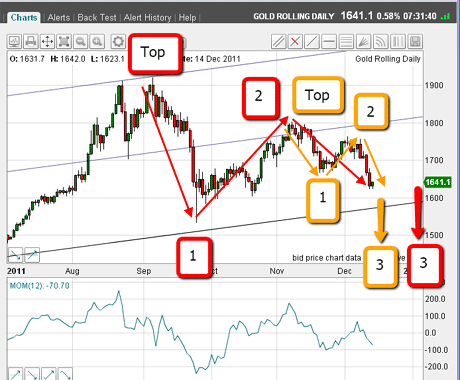
(Click on the chart for a larger version)
I can make a terrific Elliott wave count from the $1,920 top now.
The red wave labels are in the longer-term, while the yellow labels describe a shorter-term pattern (in the first chart, the impulse wave describes an even shorter-term pattern within this one).
Trader tip: In gold, we are at the start of third waves in several time-scales. For practice, why not look at your charts and see if you can spot wave counts within wave counts? Sometimes, even weekly charts can be thus analysed.
If my counts are correct, we are at the initial stages of third waves within third waves.
This is a most powerful combination, where I expect huge down days, followed by relief rallies.
Here is my second major target:
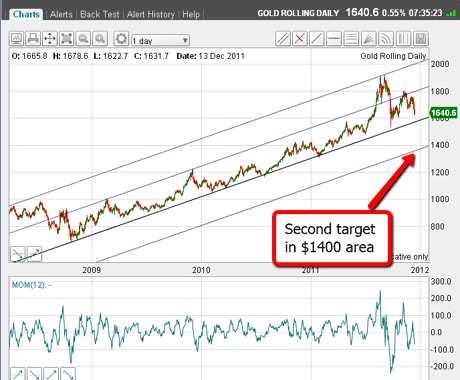
(Click on the chart for a larger version)
I have drawn my fourth tramline equidistant. If the $1,600 level can be breached, then my next target becomes the $1,400 area.
Because we are in powerful third waves, this level can be reached much sooner than most people dare imagine today.
If I do see an A-B-C pattern, wave C should end around $1,650 or just above (not allowing for the notorious spikes!). That would be a good place to look to add to short positions.
Note the profit potential here. Shorting in the $1,720 area, say, at £1 per pip, and if the market falls to $1,400, the profit would be £3,200 for a £1 spread-bet.
On Friday, I will cover either the euro or the Dow, depending on market action.
If you're a new reader, or need a reminder about some of the methods I refer to in my trades, then do have a look at my introductory videos:
The essentials of tramline trading
An introduction to Elliott wave theory
Advanced trading with Elliott waves
Don't miss my next trading insight. To receive all my spread betting blog posts by email, as soon as I've written them, just sign up here .
-
 Average UK house price reaches £300,000 for first time, Halifax says
While the average house price has topped £300k, regional disparities still remain, Halifax finds.
-
 Barings Emerging Europe trust bounces back from Russia woes
Barings Emerging Europe trust has added the Middle East and Africa to its mandate, delivering a strong recovery, says Max King

