A textbook tramline pattern forms in the pound
John C Burford looks at a classic tramline pattern in a pound v dollar trade.
Get the latest financial news, insights and expert analysis from our award-winning MoneyWeek team, to help you understand what really matters when it comes to your finances.
You are now subscribed
Your newsletter sign-up was successful
Want to add more newsletters?

Twice daily
MoneyWeek
Get the latest financial news, insights and expert analysis from our award-winning MoneyWeek team, to help you understand what really matters when it comes to your finances.

Four times a week
Look After My Bills
Sign up to our free money-saving newsletter, filled with the latest news and expert advice to help you find the best tips and deals for managing your bills. Start saving today!
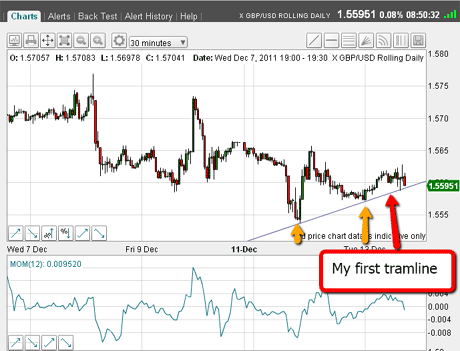
I am tracking the progress of GBP/USD (what the trade refers to as 'cable' for historical reasons), and have just seen in the last minute a cracking example of tramline formation on the 30-minute chart:

(Click on the chart for a larger version)
The lows (marked by the yellow arrows) enable me to draw my first tramline.
MoneyWeek
Subscribe to MoneyWeek today and get your first six magazine issues absolutely FREE

Sign up to Money Morning
Don't miss the latest investment and personal finances news, market analysis, plus money-saving tips with our free twice-daily newsletter
Don't miss the latest investment and personal finances news, market analysis, plus money-saving tips with our free twice-daily newsletter
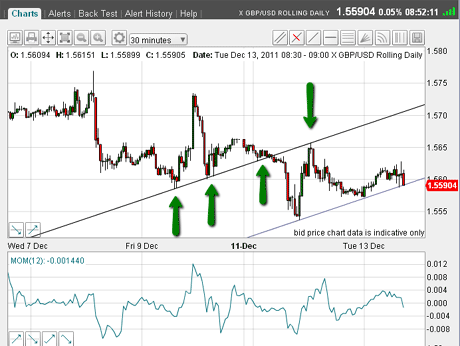
If you have studied my video tutorials on tramline trading, you will know that my next task is to search for a parallel line from previous trading and this is what I find:

(Click on the chart for a larger version)
My upper tramline takes in the multiple highs and lows marked by the green arrows almost to the tick! There are no throw-overs at all.
That is uncanny, is it not? I just had to send this out to you as a real-time example. Now I can set sell-stops to enter short trades.
Where shall I set my entry orders?
Of course, on a break of my lower tramline in the 1.5580 area.
Where shall I set my protective stop?
Just above the most recent high in the 1.5640 area.
If the market reverses upwards, it would nullify my analysis. My maximum loss would be 60 pips, well within my 3% rule.
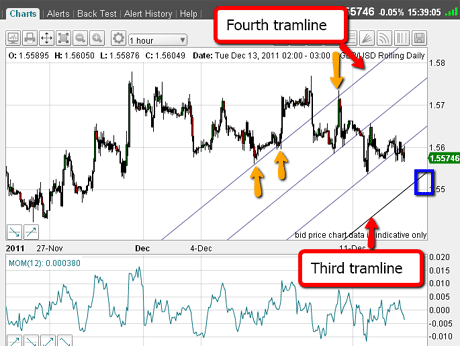
As for my first downside target, it is in the 1.55 area, which I obtained from drawing my third tramline equidistant below my initial tramline.

The third tramline shown contains my first target (in the blue box).And I have drawn my fourth tramline above, and just admire the lovely touch-points.This confirms the validity of my tramline set-up (so far!).
Let's see how this works out!
If you're a new reader, or need a reminder about some of the methods I refer to in my trades, then do have a look at my introductory videos:
The essentials of tramline trading
An introduction to Elliott wave theory
Advanced trading with Elliott waves
Don't miss my next trading insight. To receive all my spread betting blog posts by email, as soon as I've written them, just sign up here .
Get the latest financial news, insights and expert analysis from our award-winning MoneyWeek team, to help you understand what really matters when it comes to your finances.
John is is a British-born lapsed PhD physicist, who previously worked for Nasa on the Mars exploration team. He is a former commodity trading advisor with the US Commodities Futures Trading Commission, and worked in a boutique futures house in California in the 1980s.
He was a partner in one of the first futures newsletter advisory services, based in Washington DC, specialising in pork bellies and currencies. John is primarily a chart-reading trader, having cut his trading teeth in the days before PCs.
As well as his work in the financial world, he has launched, run and sold several 'real' businesses producing 'real' products.
-
 Average UK house price reaches £300,000 for first time, Halifax says
While the average house price has topped £300k, regional disparities still remain, Halifax finds.
-
 Barings Emerging Europe trust bounces back from Russia woes
Barings Emerging Europe trust has added the Middle East and Africa to its mandate, delivering a strong recovery, says Max King