Looking to trade the FTSE 100? Watch the copper market
Keeping an eye on the copper market could give you an edge in your FTSE spread betting. John C Burford explains how.
Get the latest financial news, insights and expert analysis from our award-winning MoneyWeek team, to help you understand what really matters when it comes to your finances.
You are now subscribed
Your newsletter sign-up was successful
Want to add more newsletters?

Twice daily
MoneyWeek
Get the latest financial news, insights and expert analysis from our award-winning MoneyWeek team, to help you understand what really matters when it comes to your finances.

Four times a week
Look After My Bills
Sign up to our free money-saving newsletter, filled with the latest news and expert advice to help you find the best tips and deals for managing your bills. Start saving today!
I recently took a profit in the FTSE in a short trade and the charts are telling me to return. With the stock market bullish sentiment needle hard to the right, I am on the lookout for more short trades.
Remember, selling short is no more mysterious than going long. In buying an asset (going long), you buy it first and then sell it later. In short selling, you sell the asset first, and then buy it back later.
Because the FTSE 100 is heavily weighted by commodity producers, sentiment towards the FTSE is greatly influenced by sentiment towards commodities. As we all know, that sentiment has been extremely bullish for some time, and the FTSE has been in rally mode along with commodities.
MoneyWeek
Subscribe to MoneyWeek today and get your first six magazine issues absolutely FREE

Sign up to Money Morning
Don't miss the latest investment and personal finances news, market analysis, plus money-saving tips with our free twice-daily newsletter
Don't miss the latest investment and personal finances news, market analysis, plus money-saving tips with our free twice-daily newsletter
Many markets are inter-related, but the link between the FTSE 100 and commodities is one of the strongest. And the one commodity that is the bellwether for the world economy is copper. As economies expand, copper prices tend to rise, and vice versa.
Copper has been in a massive bull market but it's stalling
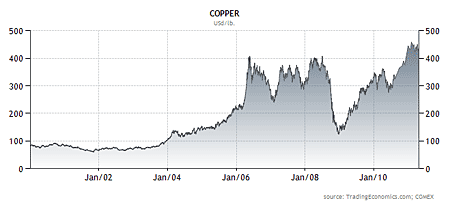
So what has been happening in the copper market? Here is a chart going back ten years:

(Click on the chart for a larger version)
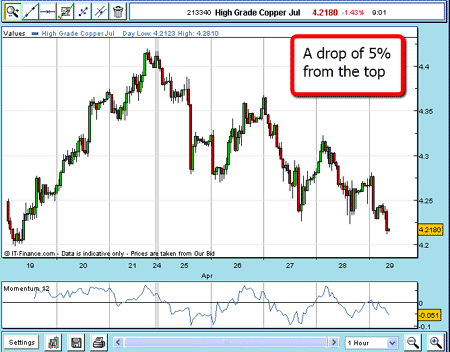
In the early 2000s, copper prices rose along with stocks until the credit crunch collapse of 2007 2009. From the lows, both copper and the FTSE 100 have been in rally mode. But in recent days, copper has been stalling:

(Click on the chart for a larger version)
With prices 5% off their peak, is this the end of the bull market for copper and hence the FTSE 100?
How is the FTSE reacting to copper's struggles?
To help us answer this question, I shall go to my trusty charts, as always.
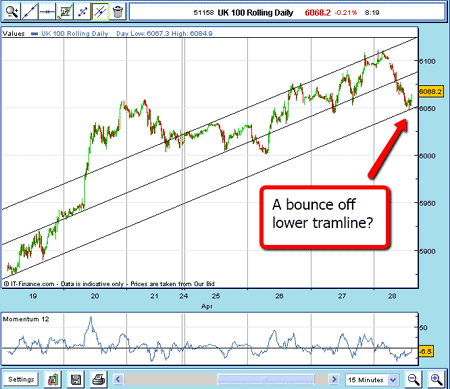
Here is recent action (up to the end of April) on a 15-minute chart:

(Click on the chart for a larger version)
I have drawn a tramline connecting the low of 19 April (and 18 April not shown) to the lows of 26 and 27 April. The market has now dropped back to this line on 28 April. Will it crash through or bounce up?
The other tramlines I have drawn look pretty good to me, with some 'overshoots' above the upper line. All in all, they are my best fit.
Remember that often we do not have perfect alignment, but must make a reasonable stab at placing our lines. Subsequent market action will always help define our placement.
So, with the market back on our lowest tramline, if it does bounce from here, a good target would be to the underside of my central tramline. I find this action occurs frequently, especially in trending markets, such as the FTSE 100.
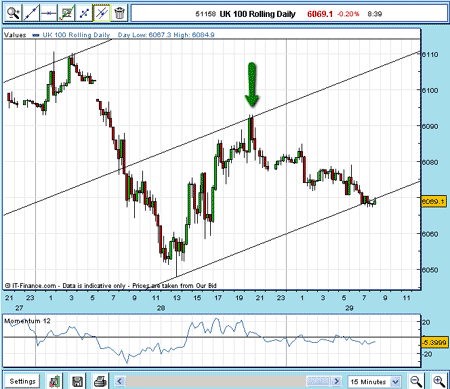
Here is trading as I write on the morning of 29 April:

(Click on the chart for a larger version)
And, indeed, the market has rallied right to the underside target and has bounced away from it in a scalded cat bounce and is now resting on my lower tramline (again).
This type of action is often bearish, at least in the short term. The market had a chance to push up through the central tramline, but was rejected. It is now testing the strength of the bulls on the lower tramline.
If this line gives way, we could be setting up an important Elliott wave pattern with a break confirming a third Elliott wave. I hope to expand on this in a later post.
A good trading strategy would have been to sell short on the rally to the 6,090 area (using a close stop) and cover (buy back) near the lower tramline at 6,068 area for a very short-term trade.
But if you are of longer-term perspective, you could be still holding your short position, anticipating a move to lower levels. You would at some stage move your protective stop to break-even following my break-even rule. You would think that a convincing break of my lower tramline should attract many sell-stops of the bulls who are using this line for protection.
But keeping an eye on the copper market, in particular, could well give you an edge in your FTSE spread betting!
NB: Don't miss my next trading insight. To receive all my spread betting blog posts by email, as soon as I've written them, just sign up here .
Get the latest financial news, insights and expert analysis from our award-winning MoneyWeek team, to help you understand what really matters when it comes to your finances.
John is is a British-born lapsed PhD physicist, who previously worked for Nasa on the Mars exploration team. He is a former commodity trading advisor with the US Commodities Futures Trading Commission, and worked in a boutique futures house in California in the 1980s.
He was a partner in one of the first futures newsletter advisory services, based in Washington DC, specialising in pork bellies and currencies. John is primarily a chart-reading trader, having cut his trading teeth in the days before PCs.
As well as his work in the financial world, he has launched, run and sold several 'real' businesses producing 'real' products.
-
 Average UK house price reaches £300,000 for first time, Halifax says
While the average house price has topped £300k, regional disparities still remain, Halifax finds.
-
 Barings Emerging Europe trust bounces back from Russia woes
Barings Emerging Europe trust has added the Middle East and Africa to its mandate, delivering a strong recovery, says Max King