The one discipline all traders need to adopt
Banish all gut feelings and listen to your head when making your trades, says John C Burford. Rely on the charts to show you the way to profits.
Get the latest financial news, insights and expert analysis from our award-winning MoneyWeek team, to help you understand what really matters when it comes to your finances.
You are now subscribed
Your newsletter sign-up was successful
Want to add more newsletters?

Twice daily
MoneyWeek
Get the latest financial news, insights and expert analysis from our award-winning MoneyWeek team, to help you understand what really matters when it comes to your finances.

Four times a week
Look After My Bills
Sign up to our free money-saving newsletter, filled with the latest news and expert advice to help you find the best tips and deals for managing your bills. Start saving today!
Stock markets have been remarkably sanguine as the debt ceiling deadline looms over the US Congress. There appears to be very little concern about the risk of a potential catastrophe.
Indeed, the sharp rallies we have witnessed over the past few days indicate that investors anticipate a happy ending.
When I left the FTSE on Monday, I asked whether the sharp rally had fully discounted the widely-held positive outcome scenario.
MoneyWeek
Subscribe to MoneyWeek today and get your first six magazine issues absolutely FREE

Sign up to Money Morning
Don't miss the latest investment and personal finances news, market analysis, plus money-saving tips with our free twice-daily newsletter
Don't miss the latest investment and personal finances news, market analysis, plus money-saving tips with our free twice-daily newsletter
The action since then has shown that the answer to that question is no, it hadn't. But this morning, I am detecting signs that the rally is running out of steam.
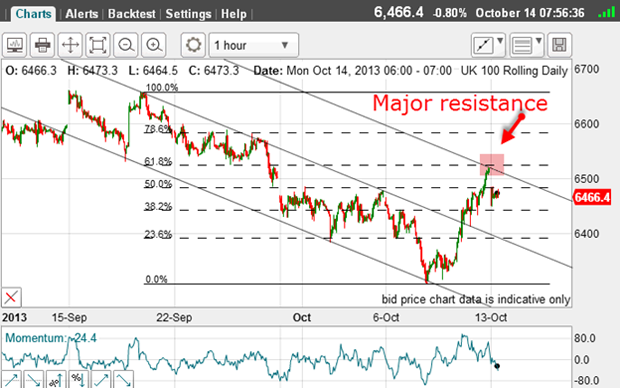
This was the chart on Monday:

Over the weekend, the market produced a gap which left the action on Friday as a spike. It carried up to the meeting of the tramline and the Fibonacci 62% retrace a powerful resistance point.
The fact that the Monday opening was on a sharp gap down showed just how powerful that resistance was.
But it wouldn't last for long, because stocks caught a bid and pushed up into new high ground.
A warning sign you need to watch for
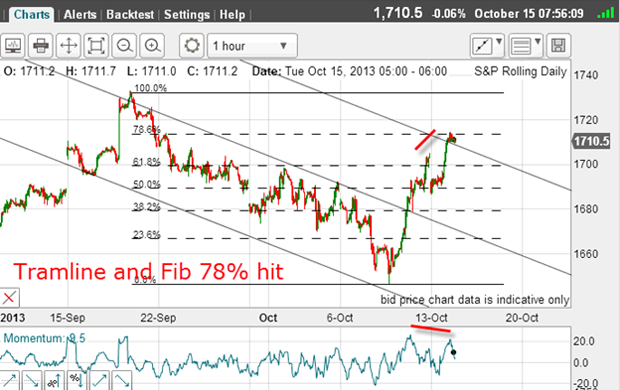
Here is the S&P as of yesterday morning:

The bullish enthusiasm for an anticipated budget/spending deal pushed the S&P to the next Fibonacci level at 78%. But it occurred on a slight negative-momentum divergence a warning that the rally was not strong.
I also have a solid tramline trio, and the market had pushed up the area of the upper tramline another zone of resistance.
Could this be the turning point?
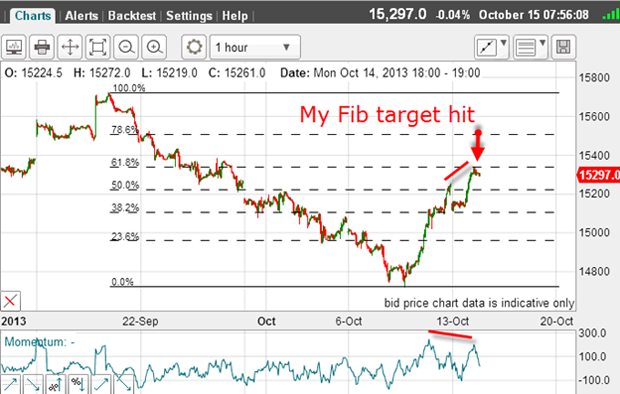
Let's see what the Dow had to offer:

This is the picture as of yesterday morning. The rally had carried to the Fibonacci 62% retrace a smaller retracement than in the S&P.
And, as in the S&P, there was a small negative-momentum divergence.
It was therefore highly likely that this would be the place where the Dow, the S&P and the FTSE would start to turn down.
After all, the bulls surely must be getting somewhat nervous as the political drama remains unsettled. It looks like it will be going to the wire.
Don't get caught in this position

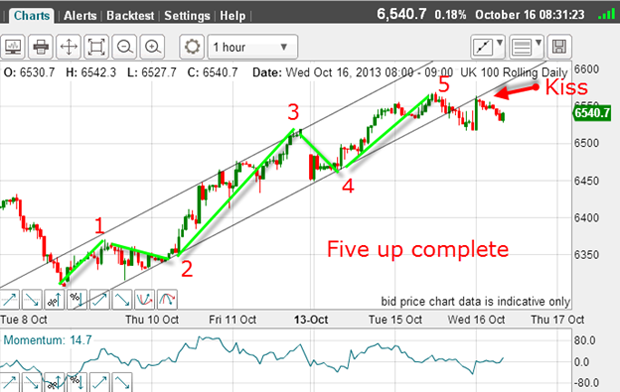
Here is my Elliott wave count from the 8 October low and I have a clear five-wave pattern. My count satisfies all of the Elliott wave rules and guidelines.
This FTSE (wave 5) high coincided with the tops in the Dow and S&P.
Remember, you can expect a reversal of some sort to correct the move up, after the fifth wave is in place.
I have drawn my lower tramline connecting wave 2 and wave 4 an Elliott rule and yesterday, the market broke below it and then rallied in a textbook kiss.
This was a superb place to enter a short trade, because a close stop could be used, giving a low-risk entry. If the market has broken back above the tramline, the pattern would be invalid.
And you certainly don't want to be in a position where you are simply hoping for the best. But many traders do, in fact, get themselves into this very position, where they are hoping for a good outcome, after their initial ideas have been proven wrong.
Gut instinct is not enough
Using the Elliott wave model, you have some firm ideas of what the market is likely to do. And if it doesn't conform, you know that your count is wrong and you should abandon the trade until you can get a better handle on the market's position.
That is one discipline I advise all traders to adopt - if the market is not behaving as you expect, either tighten your stop or get out of the trade altogether.
And your projections for the market should not be based on gut feelings! Base them on a rational analysis using a reliable system, such as I describe in my posts, workshops and videos.
As I write, the market has retreated from that kiss and is currently headed lower. Will we see a 'scalded cat bounce'?
My next post will appear on Friday, after an important deadline has passed for the US Congress to reach an agreement. In my trading, I am not guessing the outcome. That is akin to gambling!
I am simply applying my methods to the charts and reacting to the signals.
Get the latest financial news, insights and expert analysis from our award-winning MoneyWeek team, to help you understand what really matters when it comes to your finances.
John is is a British-born lapsed PhD physicist, who previously worked for Nasa on the Mars exploration team. He is a former commodity trading advisor with the US Commodities Futures Trading Commission, and worked in a boutique futures house in California in the 1980s.
He was a partner in one of the first futures newsletter advisory services, based in Washington DC, specialising in pork bellies and currencies. John is primarily a chart-reading trader, having cut his trading teeth in the days before PCs.
As well as his work in the financial world, he has launched, run and sold several 'real' businesses producing 'real' products.
-
 Japanese stocks rise on Takaichi’s snap election landslide
Japan’s new prime minister Sanae Takaichi has won a landslide victory in a snap election, prompting optimism that her pro-growth agenda will benefit Japanese stocks
-
 Alphabet 'is planning a 100-year bond': would you back Google for 100 years?
Google owner Alphabet is reported to be joining the rare century bond club