It’s time for traders to exercise caution
The tug-of-war in American politics has thrown investors into a spin. John C Burford explains how you can use the charts to navigate the volatile markets.
Get the latest financial news, insights and expert analysis from our award-winning MoneyWeek team, to help you understand what really matters when it comes to your finances.
You are now subscribed
Your newsletter sign-up was successful
Want to add more newsletters?

Twice daily
MoneyWeek
Get the latest financial news, insights and expert analysis from our award-winning MoneyWeek team, to help you understand what really matters when it comes to your finances.

Four times a week
Look After My Bills
Sign up to our free money-saving newsletter, filled with the latest news and expert advice to help you find the best tips and deals for managing your bills. Start saving today!
As the debt ceiling deadline looms, all eyes are on the US Congress. In spite of what some over-heated pundits and politicians are claiming, money appears to have settled on an eventual agreement not to plunge the world into chaos. The belief is that Armageddon will be postponed again when Congress and the president hammer out a deal whereby the US will not default, and government will continue to be funded.
The question for traders is this: has the rally late last week in stocks fully discounted this expectation?
FTSE rallies to my third tramline
MoneyWeek
Subscribe to MoneyWeek today and get your first six magazine issues absolutely FREE

Sign up to Money Morning
Don't miss the latest investment and personal finances news, market analysis, plus money-saving tips with our free twice-daily newsletter
Don't miss the latest investment and personal finances news, market analysis, plus money-saving tips with our free twice-daily newsletter
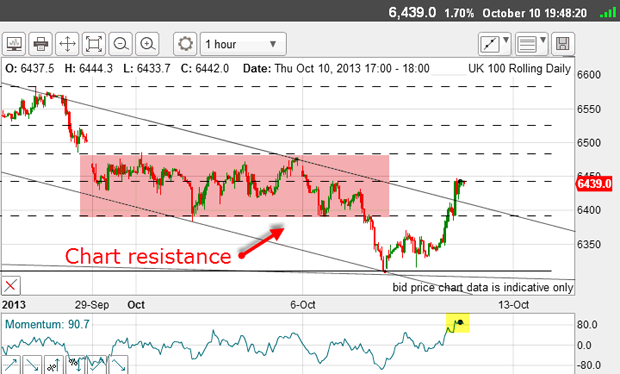
On Friday morning, I had this chart:

I had a very reliable tramline pair with a prior pivot point (PPP) on the lower tramline, and several touch points on both.
The market had rallied back to the Fibonacci 38% retrace and into chart resistance.
Would the rally stall here? After all, it was on a significant Fibonacci level, and momentum was way over-bought.
But one thing was missing the market had only just penetrated the upper tramline. Recall that I had my tramline pair in place days before, and I considered them solid lines of support or resistance.
Ideally, a reversal would occur if the market could rally up to a higher tramline the third tramline. That would be my ideal scenario.
Is the rally running out of steam?

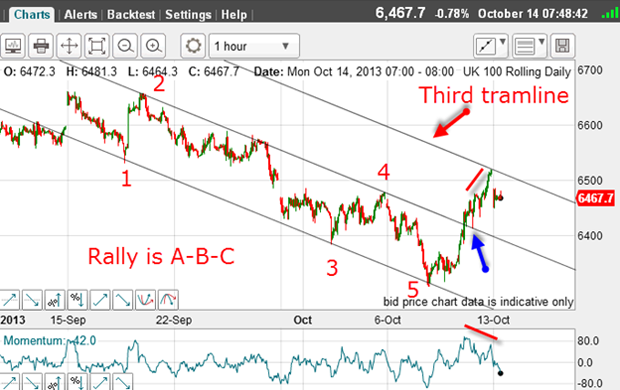
On Friday, the market did come back down and kiss the tramline (blue arrow), thereby validating the rally. It was then time for the 'scalded cat bounce', which duly arrived.
And lo and behold, right on the close on Friday, the market did advance to touch my upper tramline on the nose. That was very pretty and a great place to exit long trades and/or take a new short position.
The rally showed a negative-momentum divergence (red bars) going into the high a warning sign that the rally was running out of steam. This was yet another reason to adopt a more bearish stance.
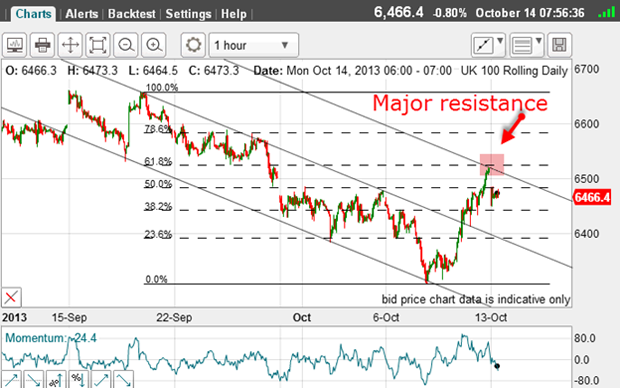
And over the weekend, the market has gapped lower, which confirms my third tramline as a major line of resistance.
Note also the rally has carried to the meeting of the tramline and the Fibonacci 62% retrace of the entire move off the wave 2 high:

This is a textbook example of the following rule: when a tramline crosses a Fibonacci retrace level, expect a turn.
A powerful indicator to determine a change of trend
This is a rare chart pattern, but is one of the most powerful indicators of a change of trend.
One reason that gaps are rare is the almost 24-hour nature of trading, with the exception of Saturdays and Sundays. If a significant news event occurs over the weekend, gaps can appear on the charts. That is exactly what has happened this weekend.
One of the main characteristics of a 'gap-n-go' is that the day after the gap (today), the market should close below its opening. The FTSE opened today at the 6,480 level (including the Sunday night action).
The key level is Friday's high at the 6,520 area. This level should not be exceeded if the gap-n-go signal is valid.
Most gaps, however, act like magnets for the market and are filled quite quickly. But a genuine gap-n-go creates a gap that repels advances, and is then a breakaway gap.
Breakaway gaps are just that they herald a breakaway from the previous trend.
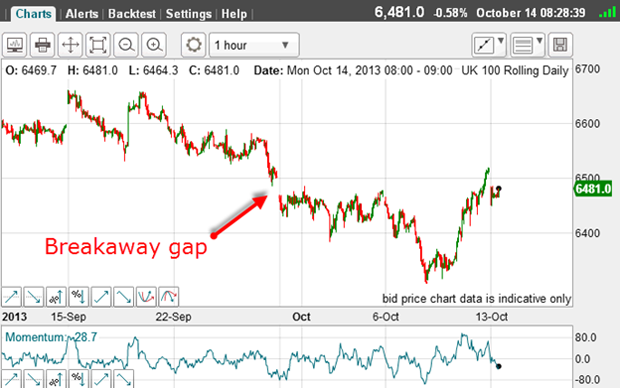
In fact, we had a breakaway gap in the FTSE exactly two weeks ago:

The market tried valiantly to fill the gap several times, but failed. As a result, the market declined by around 200 pips before stabilising. That was the w5 (wave 5) bottom.
Here, the gap was acting like a magnet before selling took control.
Of course, markets will probably remain volatile this week as the political tug-of-war in the US continues to intensify and deadlines approach.
For swing traders, it is a time for extra caution.
Get the latest financial news, insights and expert analysis from our award-winning MoneyWeek team, to help you understand what really matters when it comes to your finances.
John is is a British-born lapsed PhD physicist, who previously worked for Nasa on the Mars exploration team. He is a former commodity trading advisor with the US Commodities Futures Trading Commission, and worked in a boutique futures house in California in the 1980s.
He was a partner in one of the first futures newsletter advisory services, based in Washington DC, specialising in pork bellies and currencies. John is primarily a chart-reading trader, having cut his trading teeth in the days before PCs.
As well as his work in the financial world, he has launched, run and sold several 'real' businesses producing 'real' products.
-
 Early signs of the AI apocalypse?
Uncertainty is rife as investors question what the impact of AI will be.
-
 Reach for the stars to boost Britain's space industry
opinion We can’t afford to neglect Britain's space industry. Unfortunately, the government is taking completely the wrong approach, says Matthew Lynn