My tramline holds and the euro rallies
The euro has rallied up to the underside of John C Burford's upper tramline. Does it have the pace to burst through?
Get the latest financial news, insights and expert analysis from our award-winning MoneyWeek team, to help you understand what really matters when it comes to your finances.
You are now subscribed
Your newsletter sign-up was successful
Want to add more newsletters?

Twice daily
MoneyWeek
Get the latest financial news, insights and expert analysis from our award-winning MoneyWeek team, to help you understand what really matters when it comes to your finances.

Four times a week
Look After My Bills
Sign up to our free money-saving newsletter, filled with the latest news and expert advice to help you find the best tips and deals for managing your bills. Start saving today!
Today, I will follow up on Wednesday'spost on the euro as it has demonstrated one of the problems and solutions of trading with tramlines.
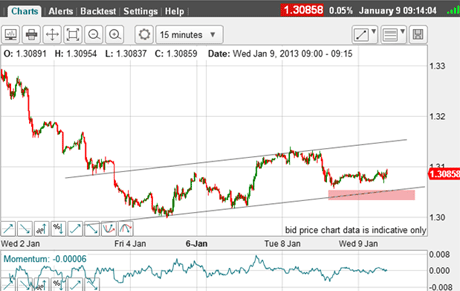
On Wednesday, I noted the market was at a crossroads and a break of the lower tramline wouldprobably point the way to lower prices.
The chart belowwas the chart asit wasthen.
MoneyWeek
Subscribe to MoneyWeek today and get your first six magazine issues absolutely FREE

Sign up to Money Morning
Don't miss the latest investment and personal finances news, market analysis, plus money-saving tips with our free twice-daily newsletter
Don't miss the latest investment and personal finances news, market analysis, plus money-saving tips with our free twice-daily newsletter
And this is what I wrote: "The danger zone for the bulls is the pink zone.
"If the market can break below the lower tramline, we should see my 1.29 target within sight."
(Click on the chart for a larger version)
Since then, the market did indeed drop beneath my lower tramline and a short sale was indicated.
But where to protect it? Certainly somewhere inside the tramline channel, and I like to use the most recent minor high as my guide.
Beware the head fake
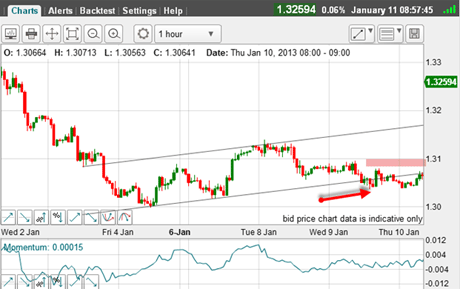
This is how trading developed later on Wednesday and Thursday:
(Click on the chart for a larger version)
A short sale could have been taken at the red arrow and protective stop in the pink zone, just above the most recent minor high.
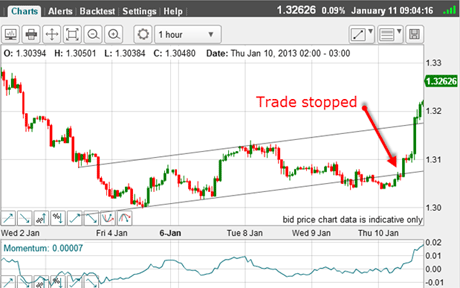
And this is how the market moved after that:
(Click on the chart for a larger version)
The market took fright from the lower tramline and roared upwards, stopping that trade out. That was another example of a head fake.
Traders must be aware that if trading up close to a tramline, you run the risk of encountering a head fake such as this.
Naturally, if you like to see more confirmation of a tramline break, you may not have taken that trade.
But one thing is certain if the market does not follow through on a tramline break, look for a swift reversal!
Why I reversed my short trade position
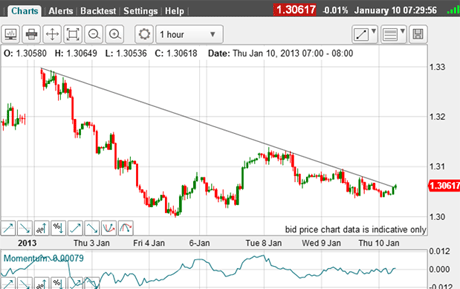
So was there any clue that this vigorous rally could have been anticipated? I believe there was, and it lies in the decline off the recent 2 January high at 1.33.
Here is my chart I had running yesterday:
(Click on the chart for a larger version)
Right away, my downtrend line sports at least eight touch points, making it a very reliable line of support/resistance. With so many precise touch points, I could say that if this line were to be penetrated, the rally should be vigorous and that is exactly what occurred.
So, my strategy after being stopped out of the short trade was to reverse position and go long on this trendline break. My protective stop was placed just below recent lows.
OK, I had a nice long position in a rapidly rising market. Where was my first target?
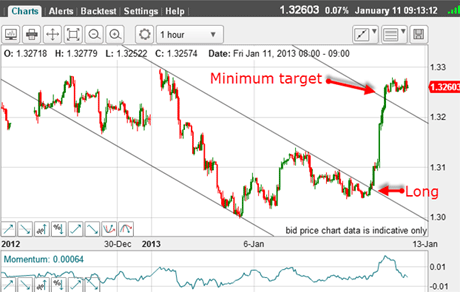
(Click on the chart for a larger version)
With my tramlines now drawn, I could set my first target around my upper tramline, which was hit yesterday.
A short-term trader would look to take profits there for a very quick 200-pip profit.
Momentum is high
So now the market is challenging the 1.33 level again a level where the market turned back previously.
The question is: will it penetrate it?
For clues, let's back up to the bigger picture. Here is the daily chart:
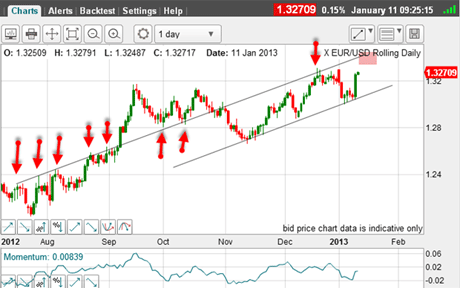
(Click on the chart for a larger version)
I have a superb upper tramline with all those prior pivot points (PPPs), while the lower tramline is good with several touch points.
If the market can rally above 1.33, the target is my upper tramline in the 1.35 area.
And with yesterday's strong thrust, momentum is high for such a push.
If you're a new reader, or need a reminder about some of the methods I refer to in my trades, then do have a look at my introductory videos:
The essentials of tramline trading
An introduction to Elliott wave theory
Advanced trading with Elliott waves
Don't miss my next trading insight. To receive all my spread betting blog posts by email, as soon as I've written them, just sign up here . If you have any queries regarding MoneyWeek Trader, please contact us here.
Get the latest financial news, insights and expert analysis from our award-winning MoneyWeek team, to help you understand what really matters when it comes to your finances.
John is is a British-born lapsed PhD physicist, who previously worked for Nasa on the Mars exploration team. He is a former commodity trading advisor with the US Commodities Futures Trading Commission, and worked in a boutique futures house in California in the 1980s.
He was a partner in one of the first futures newsletter advisory services, based in Washington DC, specialising in pork bellies and currencies. John is primarily a chart-reading trader, having cut his trading teeth in the days before PCs.
As well as his work in the financial world, he has launched, run and sold several 'real' businesses producing 'real' products.
-
 Average UK house price reaches £300,000 for first time, Halifax says
While the average house price has topped £300k, regional disparities still remain, Halifax finds.
-
 Barings Emerging Europe trust bounces back from Russia woes
Barings Emerging Europe trust has added the Middle East and Africa to its mandate, delivering a strong recovery, says Max King