The euro trades along my tramline
Evaluating the odds is crucial to making profits, says John C Burford. Here, he draws on all his charting methods to make a great risk-free trade on the euro.
Get the latest financial news, insights and expert analysis from our award-winning MoneyWeek team, to help you understand what really matters when it comes to your finances.
You are now subscribed
Your newsletter sign-up was successful
Want to add more newsletters?

Twice daily
MoneyWeek
Get the latest financial news, insights and expert analysis from our award-winning MoneyWeek team, to help you understand what really matters when it comes to your finances.

Four times a week
Look After My Bills
Sign up to our free money-saving newsletter, filled with the latest news and expert advice to help you find the best tips and deals for managing your bills. Start saving today!
It has been a while since I last covered the euro.It went to ground over the holidays when the markets' gaze was focused on the fiscal cliff in the US.
At my 17 December post, the market was rallying strongly to one of my targets in the 1.32 area. Since then, the market did manage a final thrust to 1.33, but has backed off quite sharply.
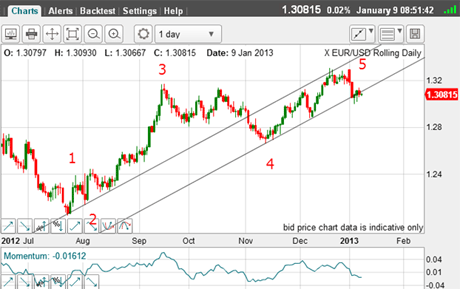
Recall I had my Elliott wave labels which pointed to the pre-Christmas rally being a fifth wave.This is what I wrote: "With the slight new high today and with a potential negative momentum divergence (red bars) we are now in the fifth wave, which could end at any time. Thus, we are potentially in two fifth waves of different degree."
MoneyWeek
Subscribe to MoneyWeek today and get your first six magazine issues absolutely FREE

Sign up to Money Morning
Don't miss the latest investment and personal finances news, market analysis, plus money-saving tips with our free twice-daily newsletter
Don't miss the latest investment and personal finances news, market analysis, plus money-saving tips with our free twice-daily newsletter
Elliott wave theory states that after the fifth wave has ended, we see a retracement.And this is precisely what occurred, with a decline of 300 pips or so.
Here is the current daily chart:
(Click on the chart for a larger version)
I have a nice tramline pair drawn in with excellent prior pivot points(PPPs) on the upper line.Naturally, with only a few touch points, I am not relying too heavily on them.
And this morning, the market is struggling with the lower tramline.
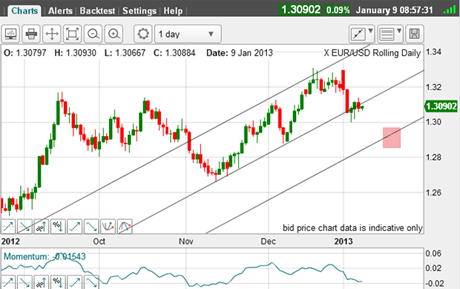
If the market declined from here, it would form an A-B-C corrective pattern, which is the ideal form.Where would the likely target be?
(Click on the chart for a larger version)
For this, we need the third tramline - a possible target is in the pink zone in the 1.29 area.
And if this occurs, it would complete the A-B-C correction and set the stage for a resumption of the rally above 1.33.
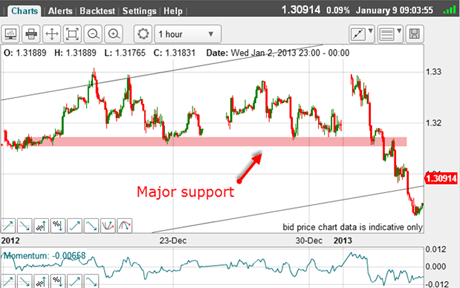
So let's back up a few days.Was there a low-risk trade on?There certainly was!
(Click on the chart for a larger version)
When the market failed at the 1.33 level, it declined to challenge the major chart support just below 1.32 (pink zone).
A short sale there was indicated - and a stop order was the best policy, of course.
The support was duly broken, and the trade was stopped in.
A second possible trade
But if this trade was missed, there was another one coming along:
(Click on the chart for a larger version)
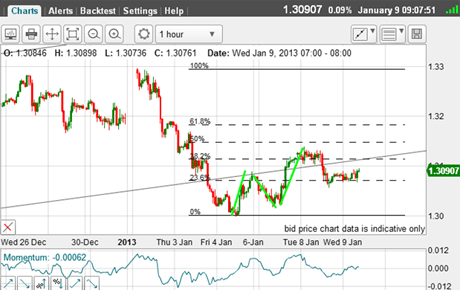
The bounce off the 1.30 low has a clear A-B-C pattern (green bars) and it carried to the Fibonacci 38% retrace.That was the place to enter a short trade.
Yesterday, the market backed off this level and is working lower as it struggles with the tramline as I write.
This trade was protected by a close stop, and now this stop can be adjusted to break-even, making this a riskless trade.
That is the essence of my style of trading: enter at a low-risk level and then move protective stop to break even when conditions allow.Take at least partial profits when targets are hit.
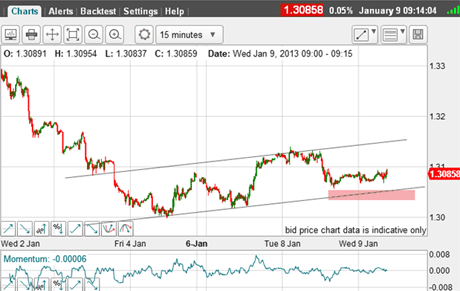
Finally, here is the 15-minute chart showing a tentative tramline pair:
(Click on the chart for a larger version)
The danger zone for the bulls is the pink zone. If the market can break below the lower tramline, we should see my 1.29 target within sight.
But if the market can rally to challenge the upper tramline, that would indicate the long-term tramline is providing enough support to overcome the bearish implications of the Elliott wave patterns.
Remember, trading the markets is a percentage game there no dead certs. All we can do is try to evaluate the relative odds of the various outcomes and protect ourselves in case we are wrong.
Being wrong is no disgrace, but losing a large chunk of your capital certainly is!
If you're a new reader, or need a reminder about some of the methods I refer to in my trades, then do have a look at my introductory videos:
The essentials of tramline trading
An introduction to Elliott wave theory
Advanced trading with Elliott waves
Don't miss my next trading insight. To receive all my spread betting blog posts by email, as soon as I've written them, just sign up here . If you have any queries regarding MoneyWeek Trader, please contact us here.
Get the latest financial news, insights and expert analysis from our award-winning MoneyWeek team, to help you understand what really matters when it comes to your finances.
John is is a British-born lapsed PhD physicist, who previously worked for Nasa on the Mars exploration team. He is a former commodity trading advisor with the US Commodities Futures Trading Commission, and worked in a boutique futures house in California in the 1980s.
He was a partner in one of the first futures newsletter advisory services, based in Washington DC, specialising in pork bellies and currencies. John is primarily a chart-reading trader, having cut his trading teeth in the days before PCs.
As well as his work in the financial world, he has launched, run and sold several 'real' businesses producing 'real' products.
-
 ISA fund and trust picks for every type of investor – which could work for you?
Whether you’re an ISA investor seeking reliable returns, looking to add a bit more risk to your portfolio or are new to investing, MoneyWeek asked the experts for funds and investment trusts you could consider in 2026
-
 The most popular fund sectors of 2025 as investor outflows continue
It was another difficult year for fund inflows but there are signs that investors are returning to the financial markets