Learn to trade with spread betting
The investment world has changed. To make money in this environment, you have to be a trader. That's why I spread bet, and why I'm here to help you with trading ideas and methods. Let me explain.
Get the latest financial news, insights and expert analysis from our award-winning MoneyWeek team, to help you understand what really matters when it comes to your finances.
You are now subscribed
Your newsletter sign-up was successful
Want to add more newsletters?

Twice daily
MoneyWeek
Get the latest financial news, insights and expert analysis from our award-winning MoneyWeek team, to help you understand what really matters when it comes to your finances.

Four times a week
Look After My Bills
Sign up to our free money-saving newsletter, filled with the latest news and expert advice to help you find the best tips and deals for managing your bills. Start saving today!
The investment world has changed. To make money in this environment, you have to be a trader. That's why I spread bet, and why I'm here to help you with trading ideas and methods. Let me explain.
In the years before the 2008/09 crash, investors could put their money into just about anything, and it would go up. Wobbles in the economy were met by central bankers cutting interest rates. 'Buy and hold' was the investing approach of the day.
That's no longer the case. Between the end of 2007 and March 2009, the Dow Jones index slid by more than 50%, from around 14,000 to 6,500. Even after 2009's huge rally, many ordinary investors will still be hugely out of pocket.
MoneyWeek
Subscribe to MoneyWeek today and get your first six magazine issues absolutely FREE

Sign up to Money Morning
Don't miss the latest investment and personal finances news, market analysis, plus money-saving tips with our free twice-daily newsletter
Don't miss the latest investment and personal finances news, market analysis, plus money-saving tips with our free twice-daily newsletter
And if anyone needed confirmation of just how unstable the new investment world is, the events of 6 May 2010 provided it in spades. That was the day of the 'flash crash' that saw the Dow Jones index lose about 1,000 points in under an hour.
Yet still many investors just don't get it. Old 'buy and hold' habits die hard. Many are still 'buying the dips'. This is a mistake. The mantra for anyone wishing to make and preserve capital in this new investment era must be 'sell-and-hold' hold cash, that is.
The big picture is gloomy, but you can still make money
I'll introduce myself. I'm John Burford. I'm a former commodity trading advisor (CTA) with the US Commodities Futures Trading Commission, and worked in a boutique futures house in California. I was a partner in one of the first futures advisory services, based in Washington DC. Pork bellies were my speciality! (Just like in the Eddie Murphy film, Trading Places). I am primarily a chart-reading trader, having cut my trading teeth in the days before PCs.
As well as trading, I am a lapsed PhD physicist. (Yes, I am a rocket scientist, having worked for NASA). And I have started, operated and sold several businesses.
In short, I've been around both trading desks and 'real' businesses for long enough to get a good feel for the financial world. And when it comes to a 'big picture' of the financial world, it is my view that we are in the early stages of a deflationary crash (it may take years to play out), as the mountain of global debt is deflated.
No amount of monetary stimulus will prevent it, as experience in the US is showing. Even after the record stimulus the US economy has hardly budged. The reason we have deflation? Western consumers (who control 70% or so of US/UK GDP) are retrenching, as the public mood is slowly changing from expansion to conservation. In short, I am bearish on asset markets. I think they're heading down.
Spread betting is the best way to profit from these volatile markets
So am I saying that you should just sit on your money? Absolutely not. There will be some spectacular opportunities for profits in the coming years. But you have to be nimble enough to catch them. You can't just take a position long or short and hope to hold on to it and profit "in the long run". That doesn't work anymore.
We might be in a long-term bear market, but there will be huge rallies along the way, just as there were during the last deflationary depression that of the 1930s.
If you don't believe me, just look at the markets. The S&P 500 has gone nowhere over ten years. And yet, we've seen huge swings up and down in the past few years, providing great profit opportunities for traders. The key is to exploit these swings.
I believe that spread betting is the best way to take advantage of these opportunities as and when they arise. And in this blog, I want to show you how I do it.
Where to find winning trades
I don't profess to know a thing about individual shares I will leave them to the experts. The markets I trade are very liquid and open almost 24 hours a day, five days a week.
I shall be writing about trading stock indices (the Dow Jones, FTSE 100, S&P 500, Nasdaq), gold, currency (or FX), and T-Bonds on the blog. They are also pretty well-behaved in that they consistently follow patterns that you can predict and profit from using technical analysis (TA).
On my blog, I'll be talking you through some of my trades which I'll use to illustrate various TA techniques, and share some useful lessons and tips about trading and spread betting.
Money management: the most important discipline for successful traders
But before I even start talking about my trading methods, we should deal with the most important trading skill first disciplined money management.
Spread betting is riskier than standard share trading. That's because you are effectively borrowing money to trade the markets (if you're unfamiliar with spread betting, I urge you to look atthis beginner's guide so that you understand the basics before reading further).
If you're not careful, one bad bet could easily wipe out your entire starting capital (and more) and end your trading career before it's begun.
Good money management is about avoiding exposing yourself to this scale of risk in the first place. This involves the prudent use of stop-loss orders to manage risk of loss. Although some traders do not use stops, I think they are crucial. If you follow my trades, you will see that I adjust my stops as the market allows, to protect any gains, and to further reduce the risk of loss.
Now it's worth understanding that ordinary stop losses are not guaranteed. If your broker for some reason cannot stop you out at the precise level you request, you may not get out at the level you expected (you can learn more about this in the beginner's guide). You can pay more in the form of a wider spread for a 'guaranteed' stop loss. In practical terms, because I am only trading the most liquid markets, the chances of my being closed out of my trade at a large distance from the original stop loss level is low, but it's not zero. So if you're at all concerned, there's nothing wrong with taking a 'belt and braces' approach
The good news is that effective money management isn't complicated. The skill lies in sticking to it, and not getting carried away by a run of good luck, or panicked by a string of losses.
The rules
I have three key money management rules:
The golden rule
Preserve your account equity the money you started your account with (in my case £4,000). How do you do that? By always following my other two rules.
The 3% rule
Never risk more than 3% of your capital on any one trade. So I will always have a stop-loss in place in order to avoid losing any more than 3% of my capital. For example, starting my account at £4,000, the 3% maximum loss is £120, or 120 points on the FTSE or Dow on a £1 bet.
The break-even rule
Move your protective stop to break-even as quickly as possible. Unfortunately, this has to be a judgment call, as there can be no hard-and-fast formula that can be stated. I hope you will see how to apply this as you follow my blogs.
The fact is, no trader gets it right 100% of the time, or anywhere close. Losses are to be expected. So what really separates those who make money in the long run, from the rest of the herd, is that they are able to avoid ruinous losses and so live to trade another day.
My strategy how I hunt down promising trades
So, on to trading. I use a mixture of classical technical analysis and a special method of my own. I'll try to keep it simple. Some of the jargon may seem confusing at first, but I'll be expanding on all of these concepts in the blog as well. So if it's not immediately clear, don't worry I'll be talking you through plenty of examples in the coming months.
Also, a word to any sceptics. Much of technical analysis may be derided as mumbo-jumbo, or an attempt to impose some sort of pattern where there's none to be found. This is a particularly prevalent view among those who are relatively new to investing and to 'value investors'.
All I'd point out is that, while I believe absolutely that you should have a 'fundamental' view on the economic outlook, the trouble with fundamentals is that they don't help you with timing. As far back as 1996, people were warning that tech stocks were overvalued. Were they right? Pretty much. Did they make any money? No.
If you're still sceptical, I'll just point out that Britain's most successful mainstream fund manager, Anthony Bolton, has said in the past that if he could only access one piece of information about a stock or market, it would be a price chart. So I'd encourage you to suspend your disbelief, and keep an open mind. You may well be surprised.
Spotting a trend: the big picture
When I begin researching a market, I bring up the weekly chart (that is, a chart of prices on a weekly, rather than a daily or monthly basis) to see if there is a long-term trend. That gives me the 'big picture'. Here is one example it's the euro versus the pound sterling over the past decade or so:
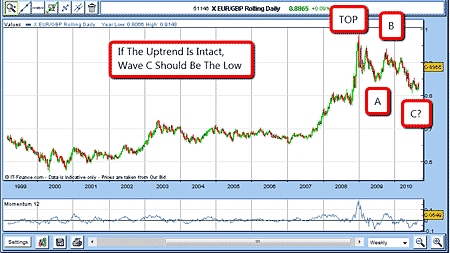
What am I seeing here? Well, there's a clear long-term uptrend over many years, then a spike up in 2008, and a three-wave correction down (marked A-B-C) to a Fibonacci level of support. Does that sound like gobbledygook? Let me explain.
Uptrend
All I mean by 'uptrend' is that the euro has clearly been rising against the pound over a long period of time (showing higher highs and higher lows). However, after the 2008 spike, the euro overshot itself, and so 'corrected' (fell back) against the pound.
Elliott wave theory
What's a 'three-wave correction'? This comes from 'Elliott wave theory'. Now you can learn more aboutElliott wave theoryin the glossary, and it's a field of analysis that can get very complicated very rapidly. But I prefer to keep it simple and use only the most basic concepts in my analysis.
What's the theory all about? Well, we all know that markets don't move in straight lines. You get dips in bull markets, and rallies in bear markets. What Elliott wave theory helps us to do, is to work out which stage we are at within a broader trend, and to get a handle on when likely turning points are going to appear.
What Ralph Elliott, who gives his name to the theory, found was that during an overall price trend, you could see a clear set of five waves three going with the trend, and two against it (counter-trend). You can see this in the simple conceptual diagram below :
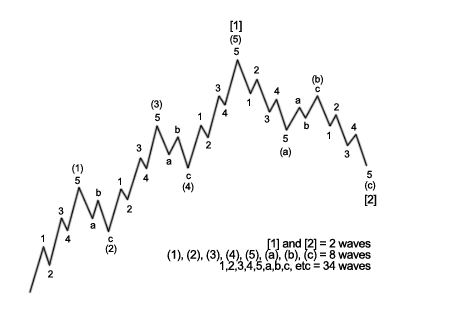
This diagram shows a market in a broad uptrend a bull market, in other words. As you can see, you have three waves where the market rises to new peaks (waves 1, 3 and 5), then two waves where it falls back (waves 2 and 4) ('corrects').
But within each of these wave movements, you have sub-sets of minor wave movements, which have a similar structure. If you just take the first wave of the five shown above, you can see that it rises to a peak in a five-wave motion there's a rise (wave 1), a fall (wave 2), another rise (wave 3), another fall (wave 4), and finally another move higher (wave 5).
Then the counter-trend move (or 'correction') comes in three waves. Let's look at that EUR/GBP chart again:

So if the trend is up as it is in this example, you 'correct' in three waves one move down (from the 'TOP' to point 'A'), a move back up (wave 'B'), and a final move down (the wave which hopefully has bottomed at 'C').
Elliott wave theory is all about trying to work out where we are in these cycles, and thus when turning points are likely to occur.
Fibonacci
Finally the Fibonacci level of support. Again, you can read more aboutFibonacci in the glossary. But to give you a rough idea of what I'm talking about, Fibonacci was a 12th century mathematician who found that certain mathematical ratios were extremely significant in describing the growth and decay of systems in nature.
Chartists argue that these apply to markets too, and so when a market falls or rises by a certain percentage, there's a greater chance that it will change trend at these 'Fibonacci levels'.
And just another quick jargon point if a market falls to a level and then bounces, this is known as finding support. If it rises to a ceiling, then falls back, that's known as hitting resistance. Read more about support and resistance in the glossary.
Confirming the trade: the daily chart
So that's the 'big picture'. Adding all these factors together, I can safely say I'm getting interested. Why? Well, we've seen the euro is rising against the pound in the long term. It is currently going through a correction (i.e. it's falling against the pound) but judging by Elliott Wave Theory, it looks as though this correction is almost over. And the fact that it has hit a Fibonacci level of support suggests it could be about to start rallying again.
When I'm trading, I want to get in at the start of a move. And all the signs are that the euro is about to start moving up against the pound again.
So what's the next step? Well, I want to take a closer look, to see if I can pin down a decent entry point for my trade.
So I go to the daily chart this shows price movements in the EUR/GBP exchange rate on a daily basis, going back to September 2009:
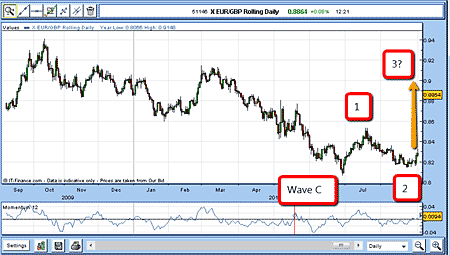
If the 29 June low is the major low (the bottom of wave 'C'), then I can count the Elliott waves 1 (up) and 2 (down). The rally at the end of this chart looks like it is wave 3 (up). A feature of third Elliott waves is that they are often very powerful ones in other words, this could have much further to go as per my big yellow arrow on the chart!
So now I am getting even more excited! I decide I shall try trading from the long side (in this case, bet on the euro rising against the pound). But how to enter at low risk?
Finding the right entry point: the intra-day chart
That's when I go to the 30-minute or 60-minute charts. This fine structure can give me great entry points. The chart below gives a 60 minute chart of the EUR/GBP from 3 September to 8 September:
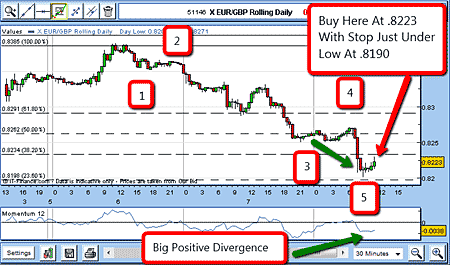
(If you're wondering what those bars on the charts are by the way, they're known as 'candlesticks'. These show us two things: whether the price moved up or down on the day, and the size of the trading range. A green candlestick shows that the price rose, a red shows that it fell. The bottom of the candlestick shows the lowest point at which the market traded that day, and the top shows its high for the day.)
You can see from the chart above, that again, even at this scale, we see Elliot waves forming. There's a first wave down (from the top, to point 1), then a wave up to point 2, then a slide to point 3, another rally to point 4, then a final move lower to what looks like being a bottom at point 5.
I place my buy order and enter my protective stop within the 3% rule. In this instance, if I buy at 0.8223, my stop loss would be placed at 0.8190 for a 33-point risk.
If the market obeys my script, we have seen the low, and I can very soon bring in my break-even rule and move my protective stop to 0.8223.
Another useful tool: the 'tramline' method
An additional technique I sometimes use is the 'tramline method'. Quite often, a market will trade between two parallel sloping lines I call these the 'tramlines'. Here is a great example in the gold chart:
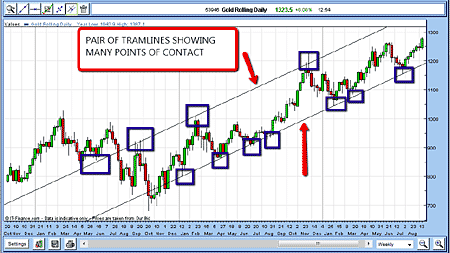
If the tramlines are sloping upwards, I look for a downward break below the lower line as a possible entry point. Similarly, if they are sloping downward, I look for an upward break above the upper line as a potential entry point. This is used in conjunction with the Fibonacci/Elliott wave analysis. I am always trying to spot trend changes, and my tramlines often tell me where to enter a trade. But they are also very often useful when trading with the trend.
And finally
Some of this may still seem confusing don't worry, I expand on all of these points and techniques in later posts. You can also comment below myposts if there are any points you'd like me to elaborate on. While I cannot offer individual advice, I will attempt to address any points raised in future posts.
One point to bear in mind is that the trades on the blog are all 'closed', past trades. These aren't trades for you to copy, they are there to help you learn some useful trading tactics for your own spread betting. Even if you don't plan to get into trading, I think you'll find that much of the advice is useful for investing in general.
Remember the most important key to succeeding as a trader is disciplined money management. Always make that your priority, and you shouldn't go far wrong and you could end up with a very profitable trading record over time.
Let's get started you can read my first post here. And remember, if you get confused at any point, just leave a comment below thepost and I will try to answer your questions in a future post.
Get the latest financial news, insights and expert analysis from our award-winning MoneyWeek team, to help you understand what really matters when it comes to your finances.
John is is a British-born lapsed PhD physicist, who previously worked for Nasa on the Mars exploration team. He is a former commodity trading advisor with the US Commodities Futures Trading Commission, and worked in a boutique futures house in California in the 1980s.
He was a partner in one of the first futures newsletter advisory services, based in Washington DC, specialising in pork bellies and currencies. John is primarily a chart-reading trader, having cut his trading teeth in the days before PCs.
As well as his work in the financial world, he has launched, run and sold several 'real' businesses producing 'real' products.
-
 Average UK house price reaches £300,000 for first time, Halifax says
While the average house price has topped £300k, regional disparities still remain, Halifax finds.
-
 Barings Emerging Europe trust bounces back from Russia woes
Barings Emerging Europe trust has added the Middle East and Africa to its mandate, delivering a strong recovery, says Max King