The best way to make money – bet against the crowd
One of the oldest mantras in trading is: 'Let the trend be your friend'. In other words, trade with the prevailing main trend, and never against it. Like all rules, this one is made to be broken – but only if you know what you're doing.
Get the latest financial news, insights and expert analysis from our award-winning MoneyWeek team, to help you understand what really matters when it comes to your finances.
You are now subscribed
Your newsletter sign-up was successful
Want to add more newsletters?

Twice daily
MoneyWeek
Get the latest financial news, insights and expert analysis from our award-winning MoneyWeek team, to help you understand what really matters when it comes to your finances.

Four times a week
Look After My Bills
Sign up to our free money-saving newsletter, filled with the latest news and expert advice to help you find the best tips and deals for managing your bills. Start saving today!
One of the oldest mantras in trading is: 'Let the trend be your friend'. In other words, trade with the prevailing main trend, and never against it. Like all rules, this one is made to be broken but only if you know what you're doing.
A glance at any price chart will reveal points where the market suddenly reverses trend and takes off in the other direction. If you are trading with the trend, this can be nasty which is one reason whymoney management discipline is so important.
On the other hand, if you are, like me, a (mostly) contrary trader one who trades against the crowd then you're always on the lookout for market tops and bottoms to trade against. Particularly when there is overwhelming public (and professional) opinion on one side of the market.
MoneyWeek
Subscribe to MoneyWeek today and get your first six magazine issues absolutely FREE

Sign up to Money Morning
Don't miss the latest investment and personal finances news, market analysis, plus money-saving tips with our free twice-daily newsletter
Don't miss the latest investment and personal finances news, market analysis, plus money-saving tips with our free twice-daily newsletter
Why are we so keen to spot these turning points? Because when the market reverses against the main body of opinion, you will get a major correction. And this is where the best profits can be made, providing you are quick.
Gold is in a long-term bull market but you can still profit by shorting it
The gold market is a perfect case of a market dominated by one-way sentiment. Read any comment or advice on gold these days, and you'll rarely see a neutral comment, let alone a bearish one.
That's not to say they're wrong. You're no doubt familiar with the bullish arguments for gold (if not, you can learn all you need to know here), and it's easy to make the case that it has further to run. But no bull market goes up in a straight line. Just as there are short-term rallies throughout bear markets, sometimes a bull market has to pause for breath.
The trick is in working out where the turning points are. And that's why we traders rely on technical analysis.
Shorting gold a sample trade
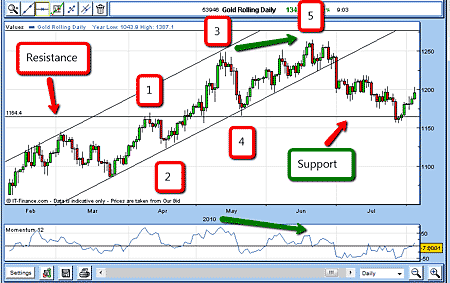
I'll illustrate this with a trade I opened and closed in July this year. Here is the gold chart on a daily scale (I'll explain the numbers below):

By March this year, gold had retreated from a very overbought condition in December 2009 (as fears over fiat currencies reached boiling point and the US dollar began to stage the beginning of its tremendous rally).
From that low point in March (which you can see on the chart above), gold began a rally that took place in five clear Elliott waves (the tops are marked at 1, 3 and 5, while points 2 and 4 indicate where waves have bottomed). Also, please note the rally into new high ground was beautifully confined to a set of tramlines in text-book fashion.
With our Elliott wave guidelines, we know that after five waves, the market will reverse and give back part of the gains.
So I was looking for a point at which to short the market after it made the 5th wave.
I noted that momentum (see the blue line underneath the main chart) was not keeping pace with price into the 5th wave. In other words, the bulls were running out of steam. As a result, I realised we could have a negative divergence set up. This is shown by the green arrows.
So on July 1st, I decided to enter a 'sell' order just below the lower tramline at $1,227.50 for £1 per point. Using my 3% rule, I set my protective stop at $1,242, so that my maximum potential loss would be of £145.
The trend turns but for how long?
I didn't have long to wait for the market to tip its hand. The next day, gold plunged right through my lower Tramline to end the day at $1,200.
Gold was starting to follow my script, as nervous longs were bailing out. So my next question was: how low could the market go before resuming the main uptrend?
Following another Elliott wave guideline, I expected the correction to take place in three waves as I've noted before, corrections in long-term uptrends usually take place in three waves. So I would look to exit at or near the bottom of the 3rd Wave, wherever that occurred.
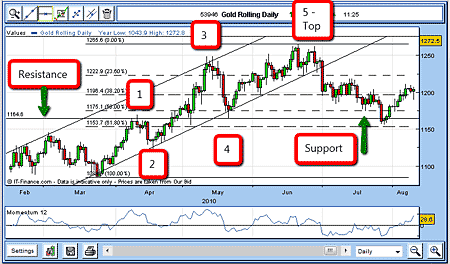
To try to get an idea of when this might happen, I use the Fibonacci tool. So, placing my Fibonacci overlay on the chart, using the $1,265 high as the 0% line (see the top black line on the chart below), and the $1,043 March low as the 100% line (see the bottom black line), I could see that there would be some congestion around the 23% to 38% areas (the dotted black lines).
But my major target was the $1,160 area. Why? For one thing, this was near the Fibonacci 50% retrace area. When there is a major correction in an overly overbought market, I find corrections more often stop at the Fibonacci 50% level, rather than anything smaller.
On top of that, this was also a level where the support line passed (the solid black line indicated by the green arrows on the chart below) another good reason to look at taking profits at this area.

(For those who are interested in getting a bit more involved in the technical analysis, there's another clue as to where the dip would stop. This is another Elliott wave guideline: corrections often stop close to the point where the 4th wave of the previous up-move bottoms out in this case, $1,165).
Always protect yourself against nasty surprises
It was all adding up. But as always, I followed my break-even rule, and moved my protective stop down to $1,227.50, just in case. The market can take you by surprise at any time, but especially so when you're trading against the major trend, so you have to be careful.
In the end, the market did co-operate and it reached my target of $1,160 on 27 July. That's where I had my buy order resting (to close out the position). That was a very satisfactory trade, made against the major trend.
1 July - Short £1 Rolling Gold @ $1,227.50. Stop at $1,242
27 July - Covered @ $1,160. Profit £67.50, or £675 on £1 bet.
The timescale for this trade was around four weeks. I find that this is typical for corrections in a major market trend. You mustn't hang around too long when trading in this way!
Get the latest financial news, insights and expert analysis from our award-winning MoneyWeek team, to help you understand what really matters when it comes to your finances.
John is is a British-born lapsed PhD physicist, who previously worked for Nasa on the Mars exploration team. He is a former commodity trading advisor with the US Commodities Futures Trading Commission, and worked in a boutique futures house in California in the 1980s.
He was a partner in one of the first futures newsletter advisory services, based in Washington DC, specialising in pork bellies and currencies. John is primarily a chart-reading trader, having cut his trading teeth in the days before PCs.
As well as his work in the financial world, he has launched, run and sold several 'real' businesses producing 'real' products.
-
 MoneyWeek Talks: The funds to choose in 2026
Podcast Fidelity's Tom Stevenson reveals his top three funds for 2026 for your ISA or self-invested personal pension
-
 Three companies with deep economic moats to buy now
Opinion An economic moat can underpin a company's future returns. Here, Imran Sattar, portfolio manager at Edinburgh Investment Trust, selects three stocks to buy now