It’s time to pay attention to the gold price
Gold has made some dramatic moves. John C Burford analyses the charts to find out where the gold price is heading to next.
Get the latest financial news, insights and expert analysis from our award-winning MoneyWeek team, to help you understand what really matters when it comes to your finances.
You are now subscribed
Your newsletter sign-up was successful
Want to add more newsletters?

Twice daily
MoneyWeek
Get the latest financial news, insights and expert analysis from our award-winning MoneyWeek team, to help you understand what really matters when it comes to your finances.

Four times a week
Look After My Bills
Sign up to our free money-saving newsletter, filled with the latest news and expert advice to help you find the best tips and deals for managing your bills. Start saving today!
It has been a while since I covered gold. But there have been dramatic developments this week, so it is high time I gave it attention.
Since my last coverage on 7 May, when the market was still in rally mode, this was the situation on the hourly chart:
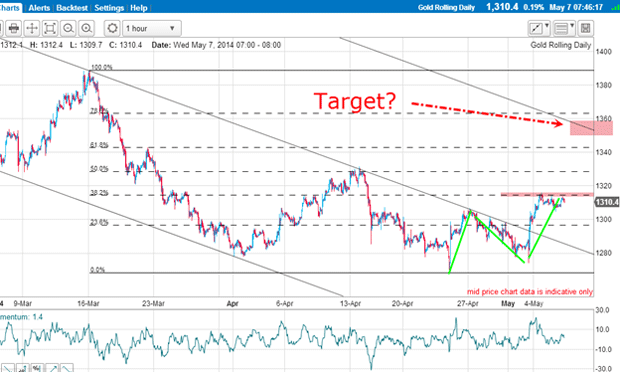
From the 24 April low at $1,270, I noted the market had made an A-B-C rally to the Fibonacci 38% resistance level and had broken above my tramline giving a buy entry signal.
MoneyWeek
Subscribe to MoneyWeek today and get your first six magazine issues absolutely FREE

Sign up to Money Morning
Don't miss the latest investment and personal finances news, market analysis, plus money-saving tips with our free twice-daily newsletter
Don't miss the latest investment and personal finances news, market analysis, plus money-saving tips with our free twice-daily newsletter
Let's zoom in on this action:
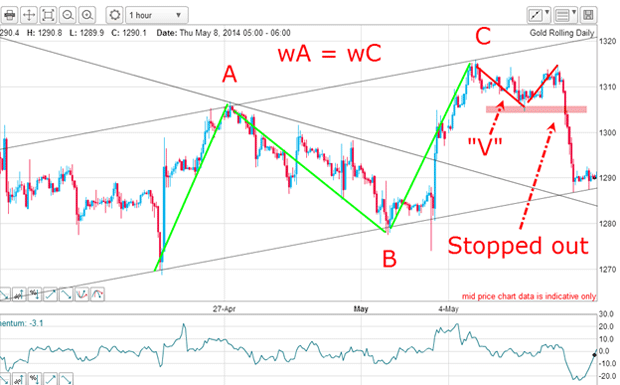
At the $1,315 print, Waves A and C are of equal height a common Fibonacci relationship. This gave me a clue that the rally might be topping.
Smart traders never marry a view
That action showed me that my rally idea had failed and I duly abandoned my $1,350 target (see first chart). Remember, we are always dealing with probabilities in the markets and the market was telling me that it didn't want to continue the rally.
I decided to just observe the market until I detected another opportunity. And from that point, the market drifted with no direction. That was why I decided to focus on other markets.
Incidentally, some traders would have stuck to their guns and held their long position. But the market had other ideas and declined instead. This is a terrific illustration of why a smart trader never marries a view and lets the market tell him or her what it wants to do.
This requires a certain flexibility of attitude and humility. This is a trait I advise all traders to perfect.
The market gives us a rare gift
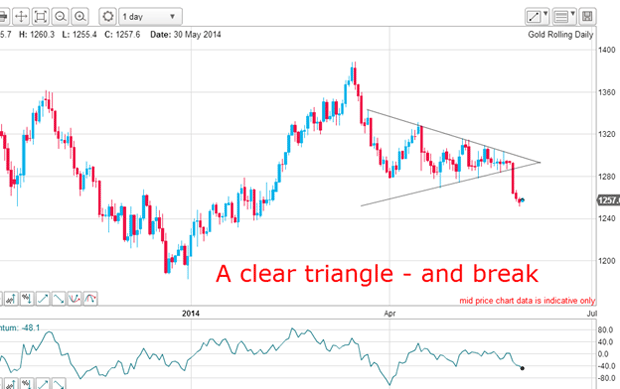
And on Tuesday, the market broke the lower line and gave a massive sell signal. Such a clear-cut triangle is a rare gift to the trader who still uses classic chart patterns.
And anyone still holding onto their bullish view would be in deep loss territory.
Remember, I was bullish until my last trade and now I am bearish with a short trade working.
There is a rule with triangles that state the extent of the move down is about equal to the maximum height of the triangle. Here it is:
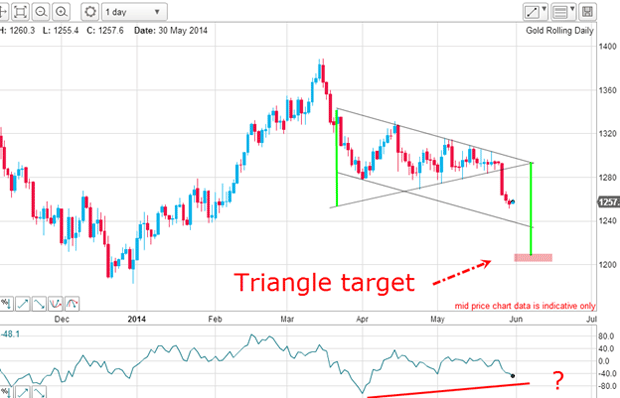
The left-hand green bar represents the height of the triangle and the right-hand bar is the extension off the triangle apex. This puts my triangle target at around the $,1200 level.
I have also drawn in a tramline pair using the upper triangle line as my upper tramline and the lower tramline target is the $1,240 area.
I have also drawn a possible positive-momentum divergence, which I expect to occur when the market eventually turns back up.
So now I have two targets one at $1,240 and the other at $1,200 or so.
Will there be a roaring rally?
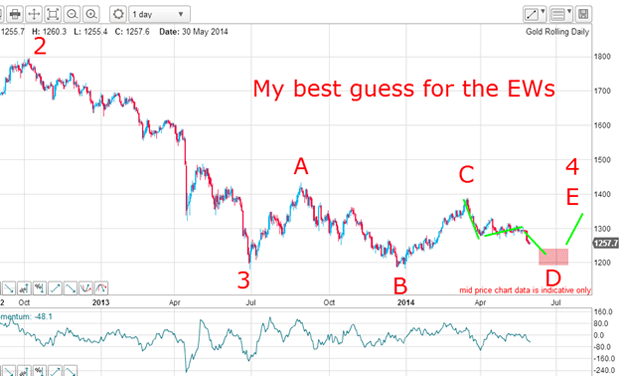
We are in the large wave 4 and the smaller D wave of a five-wave consolidation pattern. The D wave has not yet terminated and when it does, we should see a rally in wave E. That should be the wave 4 top.
Interestingly, the Daily Sentiment Index (DSI) has recently fallen to only 20% bulls, which suggests to me that we should see another spike at the D wave low, where the market could see a selling exhaustion and then a roaring rally.
But for now the trend is down and I will be on the alert for a move down to my targets.
Get the latest financial news, insights and expert analysis from our award-winning MoneyWeek team, to help you understand what really matters when it comes to your finances.
John is is a British-born lapsed PhD physicist, who previously worked for Nasa on the Mars exploration team. He is a former commodity trading advisor with the US Commodities Futures Trading Commission, and worked in a boutique futures house in California in the 1980s.
He was a partner in one of the first futures newsletter advisory services, based in Washington DC, specialising in pork bellies and currencies. John is primarily a chart-reading trader, having cut his trading teeth in the days before PCs.
As well as his work in the financial world, he has launched, run and sold several 'real' businesses producing 'real' products.
-
 Ayatollah Ali Khamenei: Iran’s underestimated chief cleric
Ayatollah Ali Khamenei is the Iranian regime’s great survivor portraying himself as a humble religious man while presiding over an international business empire
-
 'AI will change our world in more ways than we can imagine'
Interview Rob Arnott of Research Affiliates talks to Andrew Van Sickle about the AI bubble, the impact of tariffs on inflation and the outlook for gold and China