The most accurate way to forecast the markets
By getting to grips with this chart-analysis method, you can gain a window on to the markets, says John C Burford.
Get the latest financial news, insights and expert analysis from our award-winning MoneyWeek team, to help you understand what really matters when it comes to your finances.
You are now subscribed
Your newsletter sign-up was successful
Want to add more newsletters?

Twice daily
MoneyWeek
Get the latest financial news, insights and expert analysis from our award-winning MoneyWeek team, to help you understand what really matters when it comes to your finances.

Four times a week
Look After My Bills
Sign up to our free money-saving newsletter, filled with the latest news and expert advice to help you find the best tips and deals for managing your bills. Start saving today!
One of the major benefits of getting to grips with Elliot wave theory (EWT) is that it can offer you forecasts of highly likely scenarios for the market's path over all time frames. In fact, I have not found another analytical method that can give such objective and accurate forecasts.
The key word here is objective. Far too many forecasts you see are subjective and based on the bias of the forecaster. Feel free to ignore these (unless assessing sentiment, of course!).
Surely, if you can find a method that can highlight the trend and its duration, that would be something worth investigating. And that is indeed what EWT offers, as I am showing with my ongoing coverage of gold.
MoneyWeek
Subscribe to MoneyWeek today and get your first six magazine issues absolutely FREE

Sign up to Money Morning
Don't miss the latest investment and personal finances news, market analysis, plus money-saving tips with our free twice-daily newsletter
Don't miss the latest investment and personal finances news, market analysis, plus money-saving tips with our free twice-daily newsletter
And if I can combine the EW insights with my tramline and Fibonacci inputs and arrive at highly probable forecasts, that will put the odds very much on my side for discovering successful trades.
That is not to say that the EW method is 100% accurate and that it is an automatic road to riches. Being proficient requires skill and practice and because markets are probabilistic and not deterministic. In other words, placing the correct labels on the waves is never certain during the heat of the battle.
How EWT comes into its own
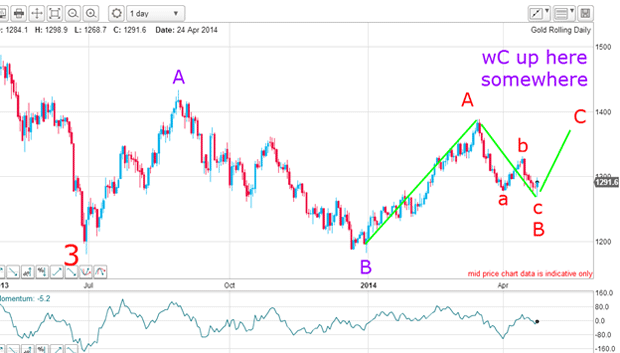
We are in a large fourth wave (the wave 3 low is the historic July 2013 low at $1,180) and from EWT, we know that fourth waves are usually very complex with many seesawing waves of several degrees (sizes).
As I pointed out, trading within fourth waves is often very treacherous and it is easy to get whipsawed one way and then another in the volatile environment of a fourth wave. This is an area where EWT comes into its own.
By January, I had already labeled the A and B (purple) waves and was expecting a purple C wave up off the B wave low, which did occur and made a high just below the much-touted $1,400 target.
Now, this high may be the purple C wave high which would lead to wave 5 (red) down below $1,180. But this is not certain at this stage I will need more chart development to make a judgment.
But I believed we had more backing and filling to do. One reason was the escalating global tensions factor and another reason was the low bullishness as indicated by the sentiment readings.
This scenario called for another three-wave pattern down off the A wave (red) high in an a-b-c pattern - and this is precisely what transpired. This was the chart then:
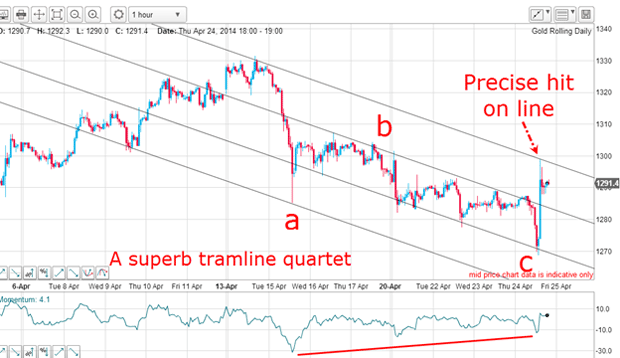
I wrote: "Now, the picture has suddenly changed from a bearish one to a potentially bullish one. This appears to be because the c wave I have been looking for is in place and the next move will be up. Confirmation will come when/if the market moves above the top tramline.
Crucially, there is a massive positive-momentum divergence at the c wave low, which supports my bullish case."
And since then, the market has moved above that tramline in a display of bullish enthusiasm (and short covering!).
The moment of truth
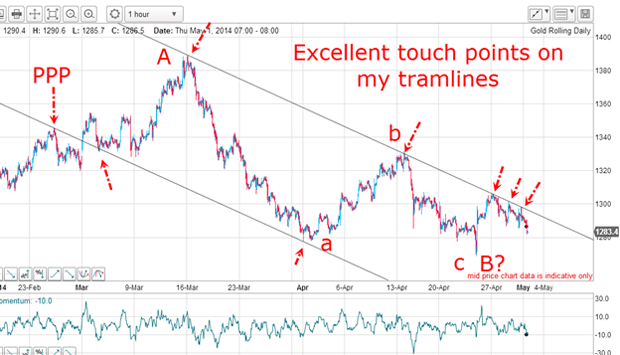
My lower tramline is excellent as it sports a solid PPP (prior pivot point) and two accurate touch points. My upper tramline likewise is excellent as it has five touch points.
So this was the moment of truth for my EW labels. We had a minor move up off the red c wave low, thereby also setting the red B wave low in place provided the market would not continue lower to make new lows for the move. This is an important point.
Crucially, EWT gives precise price levels where a particular wave count (labels) is wrong, and this is one such occasion.
The market has been turned back by the solid resistance of the upper tramline and it is clear that any upward break of this line would be immensely significant.
Not only that, but an upward break would likely carry far. This is simply because the tramline has multiple touch points that short sellers would rely on to contain rallies. You can be sure that many buy-stops would be placed above this line to contain the losses experienced by the shorts.
How to avoid emotionally charged market conditions
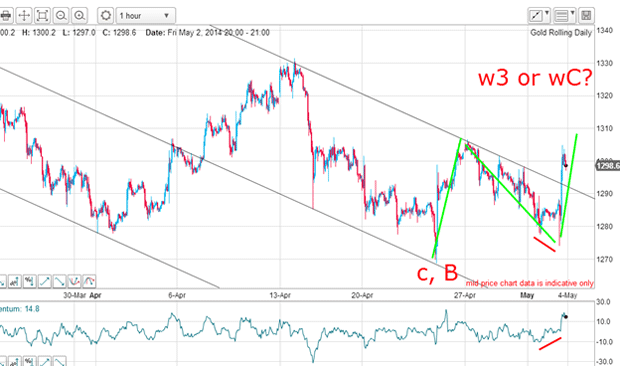
Following the US non-farms jobs data, the market sank to the $1,275 area and then began a massive rally which took the market above my upper tramline. According to my tramline trade entry method, an entry buy-stop placed just above the line would have provided a solid long entry.
This buy stop order could have been placed well before the anticipated tramline break, of course. And by employing this method, it avoids the fast market conditions that are highly emotionally-charged, where errors can easily be made in the heat if the moment!
What a difference a year makes
This is the current chart:
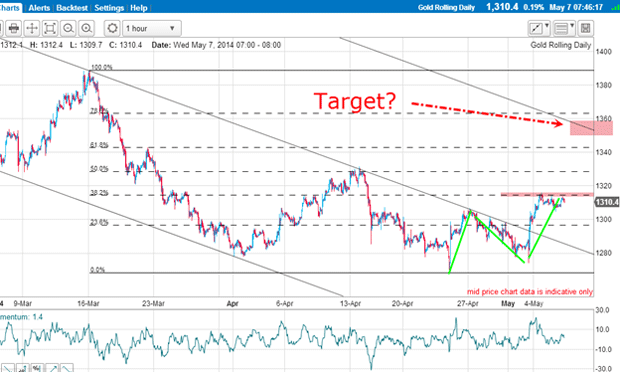
The market has carried to the Fibonacci 38% level and is encountering resistance, as is usual. If this resistance can be overcome, then the next target is the 50% level, with the possibility that the third tramline could be reached in the $1,350 area.
But with a $10 move up away from my entry, I can now adjust my protective stop to break-even which would give me a no-loss trade in the event of a decline. And if the market continues upwards, I will use my split-bet strategy to take partial profits on a scale up.
At my MoneyWeek Conference presentation on gold last Friday, I asked my audience how they felt towards the outlook for gold prices, as is my usual custom. In stark contrast to last year's showing, only around 10% were bullish, the same number bearish, but the vast majority was neutral, which indicates indecision.
It backed up my belief that we are in a complex fourth wave with no main trend, and where the market is in a large consolidation zone.
Get the latest financial news, insights and expert analysis from our award-winning MoneyWeek team, to help you understand what really matters when it comes to your finances.
John is is a British-born lapsed PhD physicist, who previously worked for Nasa on the Mars exploration team. He is a former commodity trading advisor with the US Commodities Futures Trading Commission, and worked in a boutique futures house in California in the 1980s.
He was a partner in one of the first futures newsletter advisory services, based in Washington DC, specialising in pork bellies and currencies. John is primarily a chart-reading trader, having cut his trading teeth in the days before PCs.
As well as his work in the financial world, he has launched, run and sold several 'real' businesses producing 'real' products.
-
 Can mining stocks deliver golden gains?
With gold and silver prices having outperformed the stock markets last year, mining stocks can be an effective, if volatile, means of gaining exposure
-
 8 ways the ‘sandwich generation’ can protect wealth
People squeezed between caring for ageing parents and adult children or younger grandchildren – known as the ‘sandwich generation’ – are at risk of neglecting their own financial planning. Here’s how to protect yourself and your loved ones’ wealth.