Gold is surprising the bears (again)
Sentiment is piling up on the bear side. John C Burford explains why gold could be about to spring another surprise.
Get the latest financial news, insights and expert analysis from our award-winning MoneyWeek team, to help you understand what really matters when it comes to your finances.
You are now subscribed
Your newsletter sign-up was successful
Want to add more newsletters?

Twice daily
MoneyWeek
Get the latest financial news, insights and expert analysis from our award-winning MoneyWeek team, to help you understand what really matters when it comes to your finances.

Four times a week
Look After My Bills
Sign up to our free money-saving newsletter, filled with the latest news and expert advice to help you find the best tips and deals for managing your bills. Start saving today!
I will continue the gold story, because it is throwing up some very important trading lessons.
On Wednesday, I referred to what I call the character of the gold market. Every market has its own peculiar characteristics and the longer you study different markets, the more these will be revealed to you.
That is one reason I only follow a handful of markets to trade. In fact, I have found that following too many markets can be taking the scattered blunderbuss approach lots of shot, but only a few random hits.
MoneyWeek
Subscribe to MoneyWeek today and get your first six magazine issues absolutely FREE

Sign up to Money Morning
Don't miss the latest investment and personal finances news, market analysis, plus money-saving tips with our free twice-daily newsletter
Don't miss the latest investment and personal finances news, market analysis, plus money-saving tips with our free twice-daily newsletter
By concentrating on only a few markets, you can get under their skin and can make predictions that would be impossible otherwise. A great example is the current gold market.
Why I expect the gold price to keep dropping
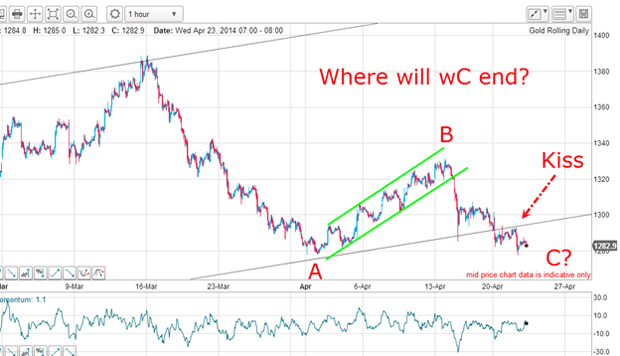
And the decline off the B wave high is marked by sharper declines and weaker rallies (and that is putting it mildly!). This tells me that it's easier for the market to make the declines than the advances. So, until the picture changes, I expect lower prices.
Gold usually bottoms on a spike move
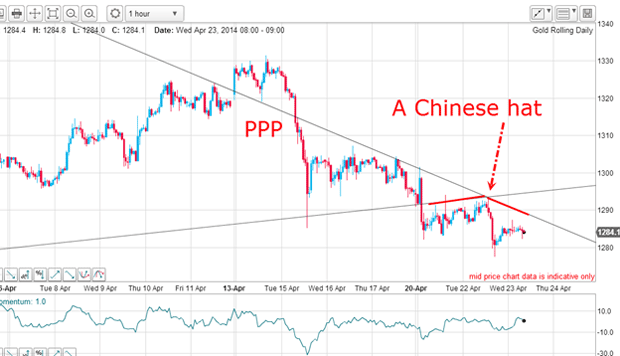
This was the chart then:
And this is the chart yesterday:
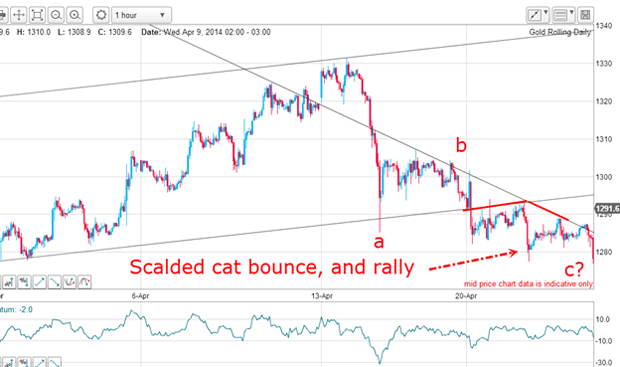
The strong resistance at the apex of the hat forced the market down, as expected. But then the market rallied back to the down-trending line before being pushed back down again. That was a clear warning that the c (red) wave I have been tracking was likely close to ending, and that I had better be alert for a reversal.
And because gold usually bottoms on a spike move a rapid move down and then up this was the scenario I was anticipating.
The short side is getting crowded
The latest COT (commitments of traders) data also revealed a sudden lurch to the bearish side on the recent decline:
| (Contracts of 100 troy ounces) | Row 0 - Cell 1 | Row 0 - Cell 2 | Row 0 - Cell 3 | Open interest: 369,577 | ||||
| Commitments | ||||||||
| 147,432 | 68,140 | 25,898 | 157,917 | 245,522 | 331,247 | 339,560 | 38,330 | 30,577 |
| Changes from 04/08/14 (Change in open interest: 4,177) | ||||||||
| -2,261 | 7,046 | 1,717 | 5,963 | -8,175 | 5,419 | 588 | -1,242 | 3,589 |
| Percent of open interest for each category of traders | ||||||||
| 39.9 | 18.4 | 7.0 | 42.7 | 66.4 | 89.6 | 91.9 | 10.4 | 8.1 |
| Number of traders in each category (Total traders: 267) | ||||||||
| 102 | 87 | 67 | 52 | 54 | 190 | 178 | Row 8 - Cell 7 | Row 8 - Cell 8 |
The speculators reduced their long positions and increased their shorts as expected that is entirely consistent with their trend-following style. Remember, to get a big upside reversal, most traders must be on the wrong side of the market, because they have to provide the short-covering fuel for the move.
Could this bearish bias set up a powerful upside reversal?
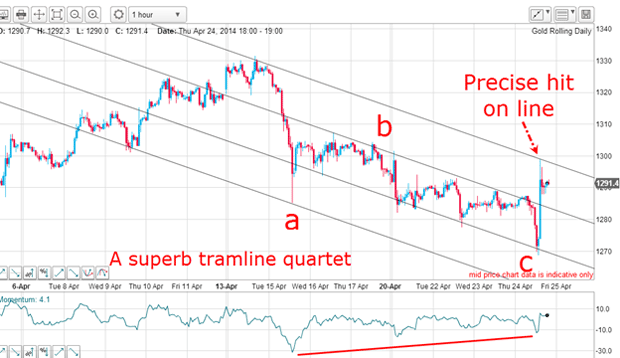
This explosive reversal produced the spike and I now have a terrific tramline set working. Note the spike low yesterday hit the third tramline and with the sudden rally off this line, the highest tramline stopped this rally dead in its tracks.
The rally only took an hour to develop and it stopped precisely at this tramline, which I drew in long before it made the hit.
Isn't that amazing? Now, how did the market know it had to stop moving up at that point? The answer is that markets are patterned and follow pre-ordained directions. What other answer can there be?
Incidentally, that is one of the great benefits of drawing in your tramlines you can set them before the market has moved. They become price targets.
The picture has suddenly changed
Crucially, there is a massive positive-momentum divergence at the c wave low, which supports my bullish case.
Any short trade taken near the Chinese hat would have been in profit quickly and that offered the opportunity to employ my break-even rule where protective stops could be moved to your entry price. On yesterday's big reversal, this stop would have been touched for a no-loss trade.
Here's where we are in the bigger picture
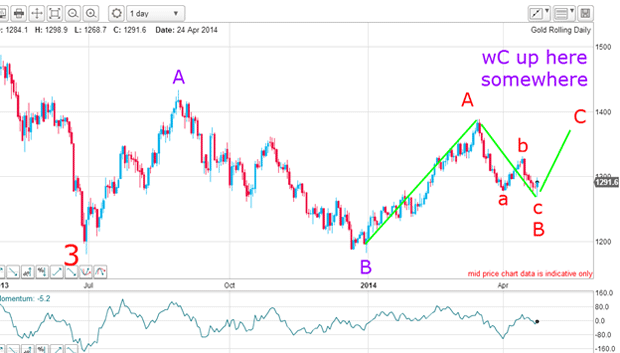
If I have identified the c wave (red) low correctly, then that also fixes the B wave (red) low. Note that these lows surround the Fibonacci 50% retrace of the A wave (red), which is a common area where turns are found. In addition, there is a whopping positive-momentum divergence building between the a and c wave lows (not marked).
This raises the intriguing likelihood that we are now in both the C (red) wave and also the C (purple) up waves that could carry the market back to the $1,400 area or even beyond.
Remember, we are still in the large wave 4 (red) pattern and these are usually very complex as is proving here. When this wave tops out, we will enter the fifth wave down, taking the market to below the wave 3 low at $1,180.
In complex fourth waves, the individual waves are mostly of the A-B-C variety as they indicate a corrective tendency to the one larger wave. When the C wave ends, another trend is formed.
In the meantime, it appears we will see another short squeeze in gold/silver and that would possibly coincide with some very interesting action in equities, which I will cover next week.
Get the latest financial news, insights and expert analysis from our award-winning MoneyWeek team, to help you understand what really matters when it comes to your finances.
John is is a British-born lapsed PhD physicist, who previously worked for Nasa on the Mars exploration team. He is a former commodity trading advisor with the US Commodities Futures Trading Commission, and worked in a boutique futures house in California in the 1980s.
He was a partner in one of the first futures newsletter advisory services, based in Washington DC, specialising in pork bellies and currencies. John is primarily a chart-reading trader, having cut his trading teeth in the days before PCs.
As well as his work in the financial world, he has launched, run and sold several 'real' businesses producing 'real' products.
-
 MoneyWeek Talks: The funds to choose in 2026
Podcast Fidelity's Tom Stevenson reveals his top three funds for 2026 for your ISA or self-invested personal pension
-
 Three companies with deep economic moats to buy now
Opinion An economic moat can underpin a company's future returns. Here, Imran Sattar, portfolio manager at Edinburgh Investment Trust, selects three stocks to buy now