Is the Dow Jones rally nearing the end?
The Dow Jones index has rallied hard from its late August lows. And sentiment among investors is bullish. But the charts may be indicating an end to the party, says John C Burford.
Get the latest financial news, insights and expert analysis from our award-winning MoneyWeek team, to help you understand what really matters when it comes to your finances.
You are now subscribed
Your newsletter sign-up was successful
Want to add more newsletters?

Twice daily
MoneyWeek
Get the latest financial news, insights and expert analysis from our award-winning MoneyWeek team, to help you understand what really matters when it comes to your finances.

Four times a week
Look After My Bills
Sign up to our free money-saving newsletter, filled with the latest news and expert advice to help you find the best tips and deals for managing your bills. Start saving today!
Next Tuesday, the US Fed will be releasing its deliberations of its latest meeting, and all eyes will be on what it has to say about tapering its bond purchases.
This unprecedented buying programme of $85bn every month of a mixed bag of bonds has been seen by many as providing the liquidity that has kept markets of many kinds supported.
It seems everyone has a view on what they will do, and there is no doubt that the stock market expects little or no impact from their plans the Dow has rallied back by a wide margin from the late August lows.
MoneyWeek
Subscribe to MoneyWeek today and get your first six magazine issues absolutely FREE

Sign up to Money Morning
Don't miss the latest investment and personal finances news, market analysis, plus money-saving tips with our free twice-daily newsletter
Don't miss the latest investment and personal finances news, market analysis, plus money-saving tips with our free twice-daily newsletter
Personally, I have no firm views I prefer to observe market expectations and trade off these.
After all, the market doesn't care what I believe. The key to successful trading is to observe what others think and to trade with this knowledge. It is best to stay agnostic on the macro factors.
Let the market speak, and never fight it.
Using classic Elliot wave theory
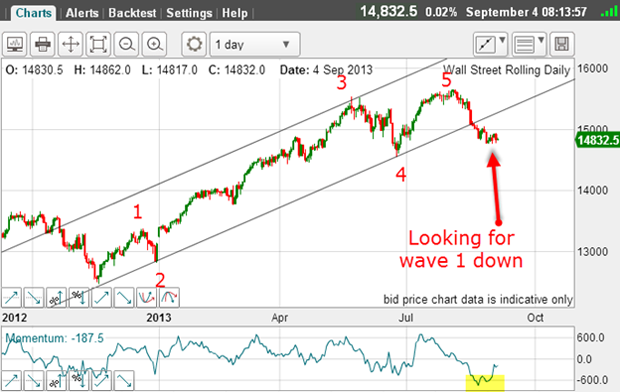
This is the daily chart I posted in my article of 4 September.
I have a clear five waves up and a break of the line joining the wave 2 and 4 lows. This indicates that the rally has topped and the new trend is down. That is standard Elliott wave theory.
The decline off the top would end in wave 1, leading to wave 2 up. That was my forecast scenario.
And this was my best guess on the hourly chart:
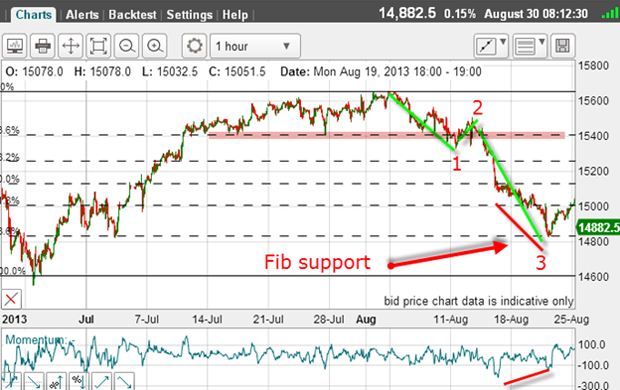
The market had fallen to the Fibonacci 78% retrace support level in what I believed was wave 3.
And the market did make a poke below my wave 3 low to the 14,780 level, where it hit support.
So I had my five waves down. That could be my large wave 1 low.
The market then became hugely volatile with 200 pip plus swings in rapid succession in the first week of September.
That made labelling the waves a very difficult task!
But this morning, I believe I have a realistic count:
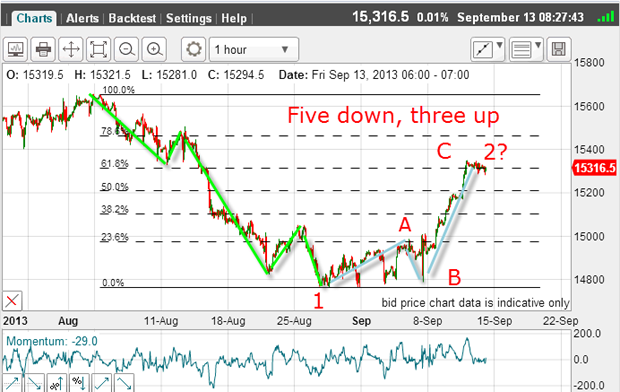
This is the hourly chart showing the five waves down in wave 1. Then, I have an A-B-C up to wave 2.
The market has reached the Fibonacci 62% retrace
The reason is that the A wave lies bang on the Fibonacci 23% level a significant resistance zone. The other highs fall short of this level.
Now let's examine the C wave in more detail. If I can count a five wave move, that should be it for this rally because fifth waves are always ending waves.
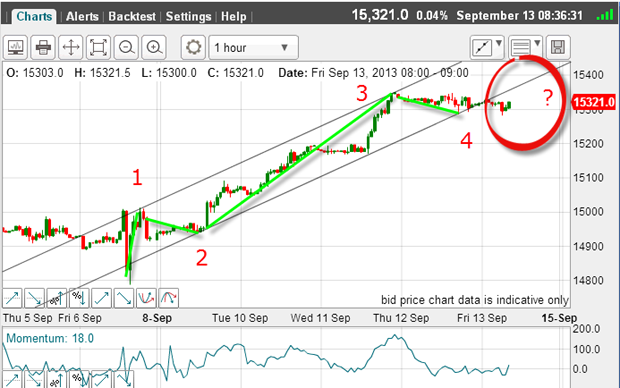
I have an excellent wave 1, wave 2 and wave 3. The third wave is long and strong, which is a requirement for third waves.
And I have drawn in my working tramlines and the lower one has been broken this morning. This tramline joins the wave 2 and wave 4 lows the correct Elliot wave procedure.
Is this a signal the turn has arrived? After all, we have a huge potential negative momentum divergence.
But I have a difficulty - I do not have my final fifth wave in a new high above wave 3. That would make the picture complete. But so far, it looks incomplete.
Two possible outcomes
My preference is for tramline kiss into a slightly new high above wave 3, but the market will decide.
Either way, it appears the rally is nearer the end than the beginning.
And my long-term picture also shows the rally has carried to the underside of my lower tramline:

Isn't that interesting?
Sentiment is off the scale
It is as if people have short memories September is one of the worst months for stocks on average. Already this month, the Dow is up over 500 pips!
Here is one indicator that I follow the AAII.com survey of private US investors:
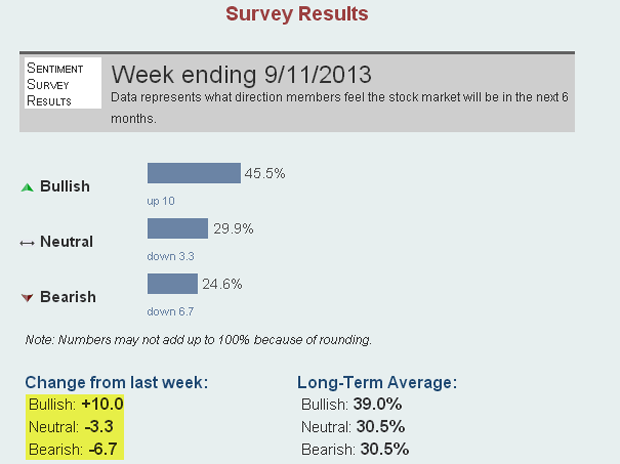
Source: www.aaii.com
For the seven days to Wednesday, the public have been bitten by the bullish bug and how!
There was a massive swing to the bull side, and just compare with the long-term averages we have a lop-sided market again as next Tuesday looms (this is Fed-Day).
The public are certainly expecting Christmas to come early this year!
This is just one of the several indicators that show me that sentiment is off the scale as wave 2 nears its end. This is entirely consistent with history.
The bottom line: the odds are great that the bulls will suffer a major disappointment and when wave 2 does end, wave 3 down will be a sight to behold.
Get the latest financial news, insights and expert analysis from our award-winning MoneyWeek team, to help you understand what really matters when it comes to your finances.
John is is a British-born lapsed PhD physicist, who previously worked for Nasa on the Mars exploration team. He is a former commodity trading advisor with the US Commodities Futures Trading Commission, and worked in a boutique futures house in California in the 1980s.
He was a partner in one of the first futures newsletter advisory services, based in Washington DC, specialising in pork bellies and currencies. John is primarily a chart-reading trader, having cut his trading teeth in the days before PCs.
As well as his work in the financial world, he has launched, run and sold several 'real' businesses producing 'real' products.
-
 Can mining stocks deliver golden gains?
With gold and silver prices having outperformed the stock markets last year, mining stocks can be an effective, if volatile, means of gaining exposure
-
 8 ways the ‘sandwich generation’ can protect wealth
People squeezed between caring for ageing parents and adult children or younger grandchildren – known as the ‘sandwich generation’ – are at risk of neglecting their own financial planning. Here’s how to protect yourself and your loved ones’ wealth.