The Dow Jones tests chart support again
A line of support in the charts is proving to be a crucial juncture for the Dow. John C Burford explains what that means for technical traders.
Get the latest financial news, insights and expert analysis from our award-winning MoneyWeek team, to help you understand what really matters when it comes to your finances.
You are now subscribed
Your newsletter sign-up was successful
Want to add more newsletters?

Twice daily
MoneyWeek
Get the latest financial news, insights and expert analysis from our award-winning MoneyWeek team, to help you understand what really matters when it comes to your finances.

Four times a week
Look After My Bills
Sign up to our free money-saving newsletter, filled with the latest news and expert advice to help you find the best tips and deals for managing your bills. Start saving today!
Last Friday, I noted the Dow had completed a classic five-wave down pattern and was attempting to make a base in the 14,800 region. The rally to Friday had been a weak affair to that date.
The market had declined, with the wave 3 being characteristically long and strong:
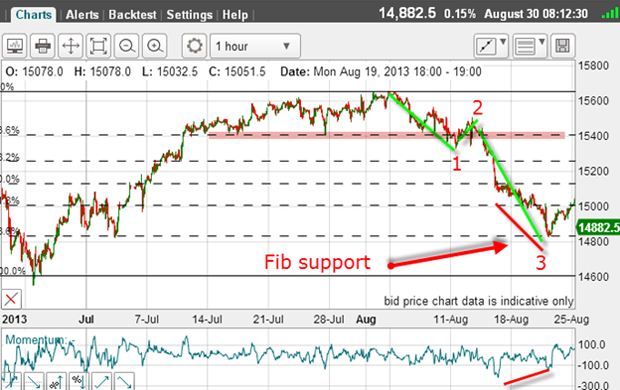
Wave 3 had also found support at the Fibonacci 76% retrace level and on a positive-momentum divergence.
MoneyWeek
Subscribe to MoneyWeek today and get your first six magazine issues absolutely FREE

Sign up to Money Morning
Don't miss the latest investment and personal finances news, market analysis, plus money-saving tips with our free twice-daily newsletter
Don't miss the latest investment and personal finances news, market analysis, plus money-saving tips with our free twice-daily newsletter
The only question then was how high would wave 4 carry?
The action late last week seemed to verify that wave 4 was complete at the shallow 23% retrace of the entire move off the early August highs:
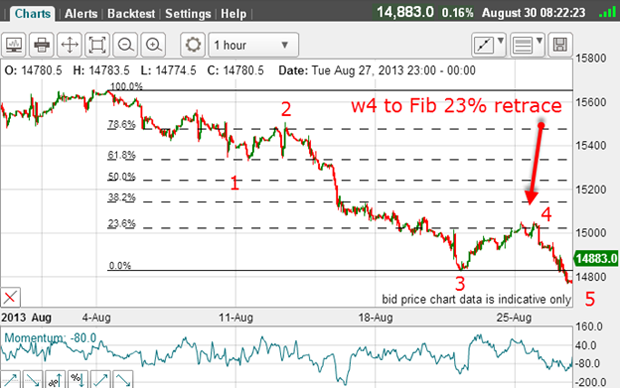
After this wave 4 was in place, the market moved lower into new low ground to make the fifth wave.
Monday was Labor Day in the US so the NYSE was closed, but that did not stop the overseas markets making a move - money never sleeps!
With the dramatic developments in the Syria crisis over the weekend, the Dow gapped up on Monday and this move produced a slightly higher high above my wave A label:
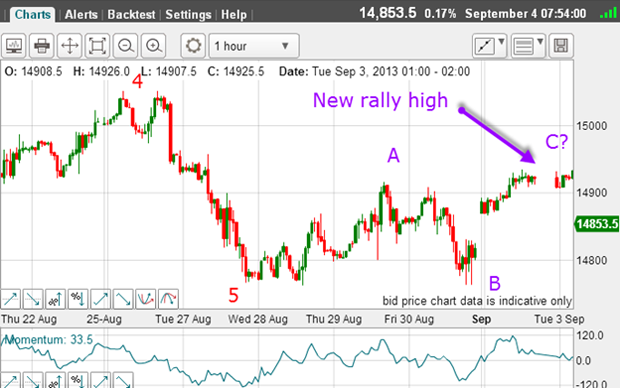
If this is correct, then when the C wave terminates we should see a resumption of the down trend.
Mind the gap
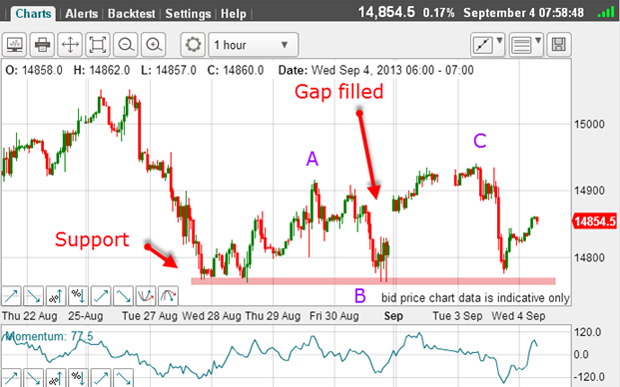
The C wave is holding and the market moved sharply back down to support and filled Monday's gap.
Trader tip: Because markets are open virtually 24 hours a day, gaps are very unusual (except in individual shares, which have fixed trading hours). A gap occurs when there is a sharp jump in price from one trade to the next, usually in response to a news release.
In stock indexes, they only occur on weekends when markets are closed. But one of the features of gaps is that very often, they are closed soon afterwards as occurred here.
So this is my Elliott wave reading of the position: We have a completed A-B-C counter-trend rally up, which has helped alleviate the oversold momentum on the daily chart (see yellow highlight in next chart). The market is likely still in a large third wave down which has not yet completed.
The key is breaking the support at the 14,780 area. If that breaks convincingly, the third wave has not yet completed. The next target then is the critical June low at 14,550.
This whole move is part of an even larger wave 1 off the August top and when that terminates, there will be a move back up in a large wave 2. That wave may rally back to the underside of the lower tramline:
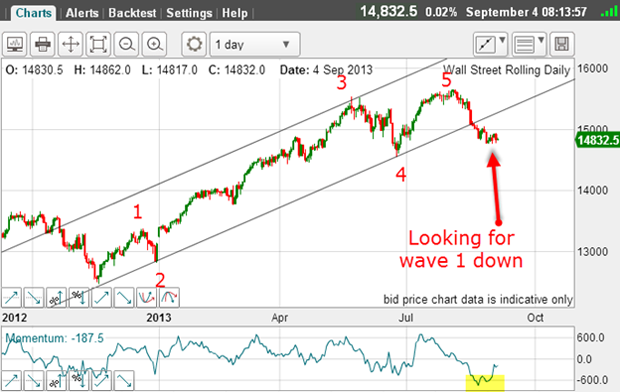
So here is my best guess for the short term:
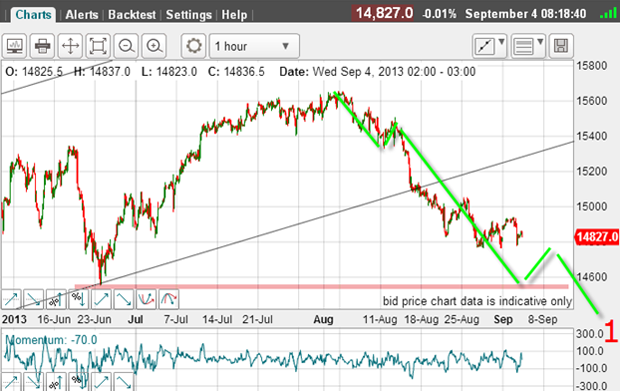
Wave 3 should end near the 14,550 low, then another bounce in wave 4, and finally, a break of that low in wave 5. This will be the larger wave 1 down before a major rally gets under way.
What could spoil this scenario? A rally from here back for a traditional kiss of the underside of the tramline would be OK, since the odds would favour a bounce down off it in a scalded-cat bounce.
In reality, the only fly in the ointment would be for the market to rally above the 15,650 high and that appears a remote possibility.
Perverse markets
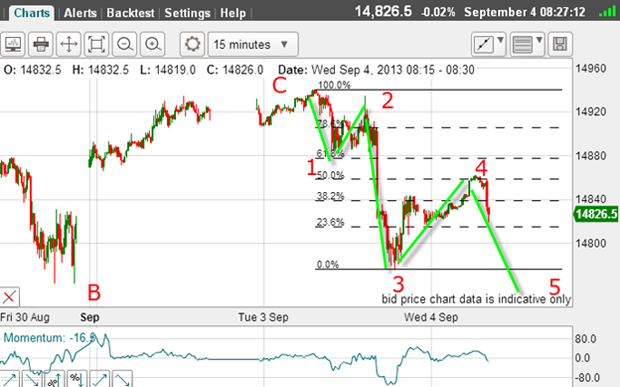
I have waves 1, 2, and 3 with wave 3 long and strong, and this morning wave 4 seems to have completed at the Fibonacci 50% retrace (this is a common retracement level, remember).
And note that wave 4 has a distinct A-B-C form again, confirmation it is counter-trend to the main downtrend.
As I write, the market is backing off this resistance and heading back towards the support level around the wave 3 low.
That wave 4 high was yet another excellent short entry point, as was the wave C high.
As a technical trader, you can use these wave extremes to make trade entries at low risk provided you understand the bigger Elliott-wave picture and the forces at work.
If you were paying attention to the US economic reports yesterday, they were generally better than expected. If you trade on the news, you would have been buying into a falling market as the Dow dropped by over 100 pips after the data release.
This is one way you can judge the mood of the market. If the market falls on good' news, then you can infer that an improving economy will be bad for stocks. How's that for perversity?
Get the latest financial news, insights and expert analysis from our award-winning MoneyWeek team, to help you understand what really matters when it comes to your finances.
John is is a British-born lapsed PhD physicist, who previously worked for Nasa on the Mars exploration team. He is a former commodity trading advisor with the US Commodities Futures Trading Commission, and worked in a boutique futures house in California in the 1980s.
He was a partner in one of the first futures newsletter advisory services, based in Washington DC, specialising in pork bellies and currencies. John is primarily a chart-reading trader, having cut his trading teeth in the days before PCs.
As well as his work in the financial world, he has launched, run and sold several 'real' businesses producing 'real' products.
-
 Early signs of the AI apocalypse?
Uncertainty is rife as investors question what the impact of AI will be.
-
 Reach for the stars to boost Britain's space industry
opinion We can’t afford to neglect Britain's space industry. Unfortunately, the government is taking completely the wrong approach, says Matthew Lynn