The Dow Jones completes five waves down
After a fave-wave move down in the Dow , a counter-trend rally should be on the cards. Will it play out? John C Burford examines the charts.
Get the latest financial news, insights and expert analysis from our award-winning MoneyWeek team, to help you understand what really matters when it comes to your finances.
You are now subscribed
Your newsletter sign-up was successful
Want to add more newsletters?

Twice daily
MoneyWeek
Get the latest financial news, insights and expert analysis from our award-winning MoneyWeek team, to help you understand what really matters when it comes to your finances.

Four times a week
Look After My Bills
Sign up to our free money-saving newsletter, filled with the latest news and expert advice to help you find the best tips and deals for managing your bills. Start saving today!
When I last covered the Dow on 21 August, the market was in the process of stair-stepping its way lower, on what I hoped was a third wave.
Remember third waves are usually long and strong. Their signature characteristic is a rapid move in one direction. When I see the market move decisively lower making a cliff-edge' trace on the chart, then I suspect I am in a third wave.
Here was the hourly chart back then:
MoneyWeek
Subscribe to MoneyWeek today and get your first six magazine issues absolutely FREE

Sign up to Money Morning
Don't miss the latest investment and personal finances news, market analysis, plus money-saving tips with our free twice-daily newsletter
Don't miss the latest investment and personal finances news, market analysis, plus money-saving tips with our free twice-daily newsletter
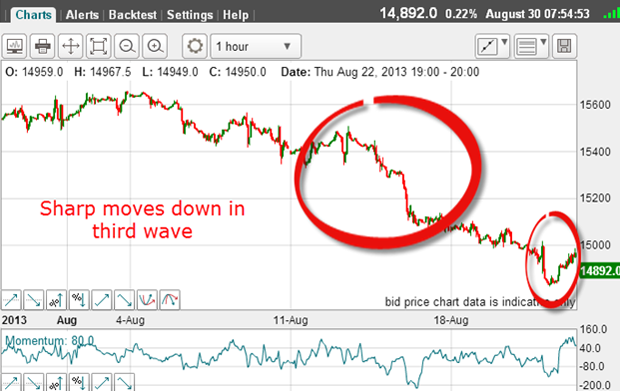
This is the type of action I was looking for and it indicated to me that I have a genuine third wave working.
Now if I could identify the end of this third wave, I had a likely target for short-term profits.
Finding my short-term target
Why did I do this? Simply because the Fibonacci retrace levels often represent strong support and from there the down move could be turned around. This would give me one clue to help me find my short-term target where I would take profits.
Here are my Fibonacci levels which I had placed on my chart since the 4 August top:
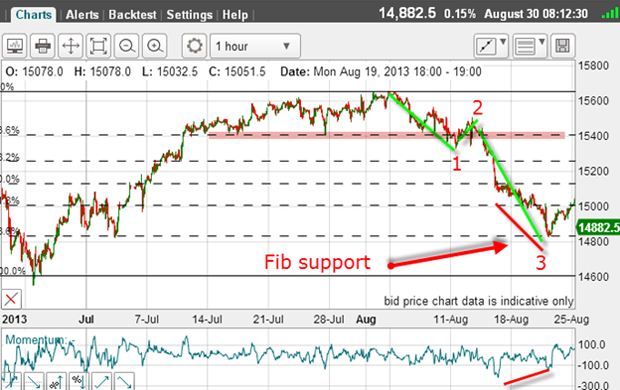
The 15,400 shelf of support neatly coincided with the 23% level (this is common), which gave me confidence that the other Fibonacci levels would be respected.
As the market dropped down towards the 76% level, I noted the potentially large positive-momentum divergence (red bars). This meant the selling pressure was drying up and to get ready for a snap-back rally in wave 4.
And as the market hit the Fibonacci level, I decided to take my short-term profit of over 600 pips on my short trade.
And as the market rallied off this support, I knew I was in wave 4 up. Of course, I had little idea how high this wave would carry, although a rally to the Fibonacci 23% retrace of the wave down would be the bare minimum.
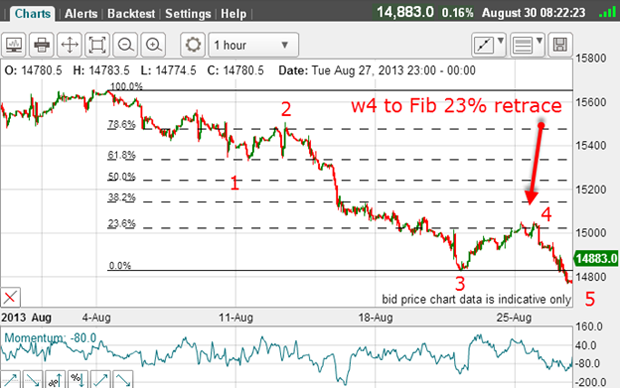
And so it played out, the wave 4 (w4) slightly overshot the 23% retrace. The market then turned around and went on to make a new low in wave 5.
Now I can say that the trend is down, as I have a completed five wave impulse pattern. But what now?
After a five wave move, I believe it should have a counter-trend rally, preferably in three waves.
So what is the picture this morning?
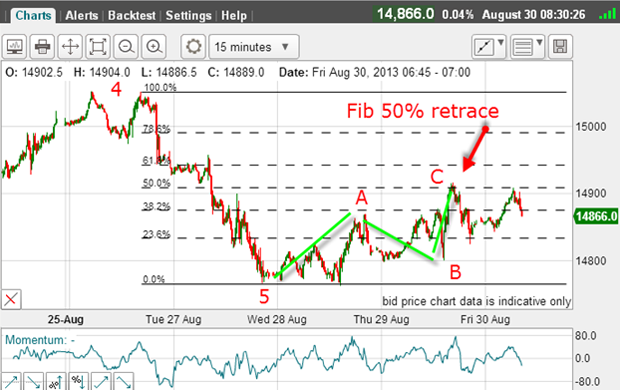
Well, I have my A-B-C rally, but it has stalled at the Fibonacci 50% retrace of wave 4. This is a very weak rally so far.
And that is a crucial point. If after such a solid move down as we have seen (over 800 pips), the rally is weak; then if this holds the move down should resume in earnest.
That is why the Wednesday low at 14,760 is a key level. If this is broken soon, the move down should gather pace.
That thinking was behind my decision to reinstate my short position at the C wave rally. And I was able to enter a very close protective stop because if the rally extended, my shallow rebound theory was likely wrong and I wanted to be out.
As for tramlines, I am unable to find any decent ones on the hourly chart, but my long-term tramlines are still working:
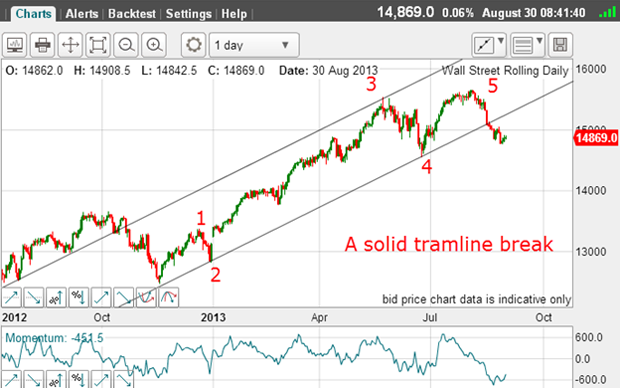
I have my complete five waves up and a solid tramline break.
The move down is a new wave 1 which appears to be incomplete. The big test though is the Wednesday low at 14,760. That is my line in the sand. If the market breaks that level, wave 1 down is still in progress.
But if this low holds, then the wave 1 low is in place and the market will move up in wave 2. Momentum is oversold here, but it often stays oversold for a long time when the market is in a sharp move. I don't see there is a reason to go long!
In any case, my new short-term short trade is protected by a very close stop to limit any loss. I await the next move.
Get the latest financial news, insights and expert analysis from our award-winning MoneyWeek team, to help you understand what really matters when it comes to your finances.
John is is a British-born lapsed PhD physicist, who previously worked for Nasa on the Mars exploration team. He is a former commodity trading advisor with the US Commodities Futures Trading Commission, and worked in a boutique futures house in California in the 1980s.
He was a partner in one of the first futures newsletter advisory services, based in Washington DC, specialising in pork bellies and currencies. John is primarily a chart-reading trader, having cut his trading teeth in the days before PCs.
As well as his work in the financial world, he has launched, run and sold several 'real' businesses producing 'real' products.
-
 MoneyWeek Talks: The funds to choose in 2026
Podcast Fidelity's Tom Stevenson reveals his top three funds for 2026 for your ISA or self-invested personal pension
-
 Three companies with deep economic moats to buy now
Opinion An economic moat can underpin a company's future returns. Here, Imran Sattar, portfolio manager at Edinburgh Investment Trust, selects three stocks to buy now