The 'fear index' is rising - has the Dow peaked?
The great bull market in the Dow is probably drawing to a close. And when the market capsizes, says John C Burford - it will take many traders with it.
Get the latest financial news, insights and expert analysis from our award-winning MoneyWeek team, to help you understand what really matters when it comes to your finances.
You are now subscribed
Your newsletter sign-up was successful
Want to add more newsletters?

Twice daily
MoneyWeek
Get the latest financial news, insights and expert analysis from our award-winning MoneyWeek team, to help you understand what really matters when it comes to your finances.

Four times a week
Look After My Bills
Sign up to our free money-saving newsletter, filled with the latest news and expert advice to help you find the best tips and deals for managing your bills. Start saving today!
When I last covered the Dow on 9 August, the market had made a high five days earlier at the 15,650 level. The waves down off that high suggested that the top was in, but it was too early to place very high confidence in that forecast.
I had a complete Elliott wave count up to the high, but needed a clear five waves down to help confirm.
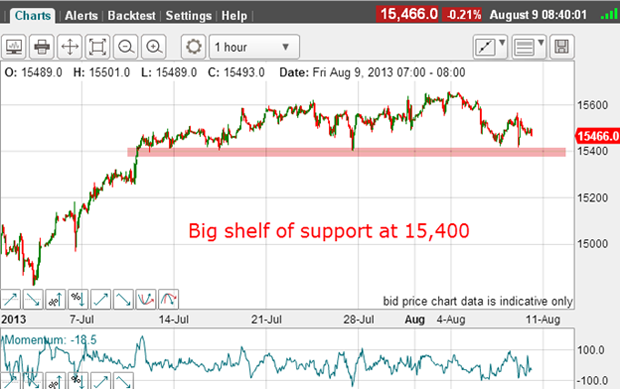
Here is the hourly chart I showed then:
MoneyWeek
Subscribe to MoneyWeek today and get your first six magazine issues absolutely FREE

Sign up to Money Morning
Don't miss the latest investment and personal finances news, market analysis, plus money-saving tips with our free twice-daily newsletter
Don't miss the latest investment and personal finances news, market analysis, plus money-saving tips with our free twice-daily newsletter

The market had declined in five waves, but there was an alternative interpretation of equal merit that the market had declined to support at the pink bar and was about to resume the rally to new highs.
As I wrote then: "So my lines in the sand are the 15,650 level in the Dow on the upside, and the support at 15,400 level on the downside".
To confirm that the trend had changed to down, I needed to see in addition to the five-wave move down a penetration of that shelf of support at 15,400.
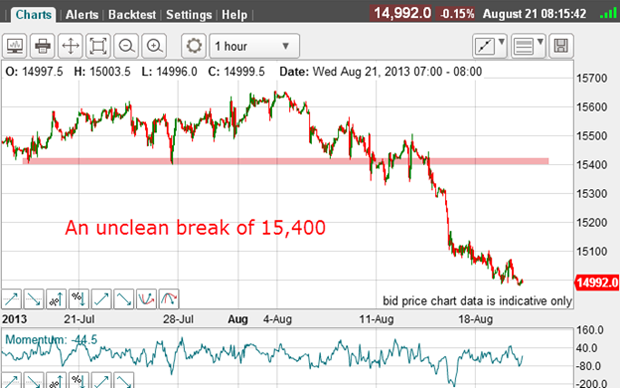
And later on 9 August, the market did indeed break that support but not without a fight:

After the break, which was a natural place to enter short trades, the market bounced up to the 15,500 level. In this situation, with wide and volatile swings, the only strategy that made sense was to place protective stops far away.
A stop of 150 or even 200 pips would be required to give yourself a good chance of staying in the trade and not being knocked out by a rogue spike.
But with the last gasp rally attempt to 15,500, the market fell heavily over the next few days and is trading well below the support shelf, which is now resistance to any rally attempt.
This brings up a fundamental question: what type of trader are you?
What is your trading style?
But if you are of a more conservative disposition, you would not jump the gun and you would wait for more evidence of a new trend. When you do enter, the trend is well developed and your risk is larger since your stops need to be farther away.
Both styles can work well, but every trader must understand where their risk profiles fit in the spectrum. There are no right or wrong ways to trade, but your style must suit your own personality and that is where trading psychology comes in.
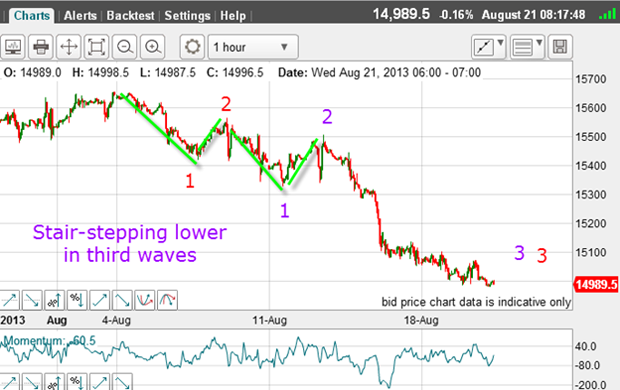
Stair steps

And the zig-zag nature of the decline means that the decline is making 1-2 waves at various degrees with the sharp drop being a "third of a third".
When we have two third waves of different degrees, these are among the most powerful waves and usually go farther than (almost) anyone expects.
With this third wave, I am now much more confident that the Dow top was made on 4 August at 15,650.
This is a day that will surely go into the history books as marking the end of the massive stimulus-inspired bull market in US equities over the past four years or so.
The complacency index
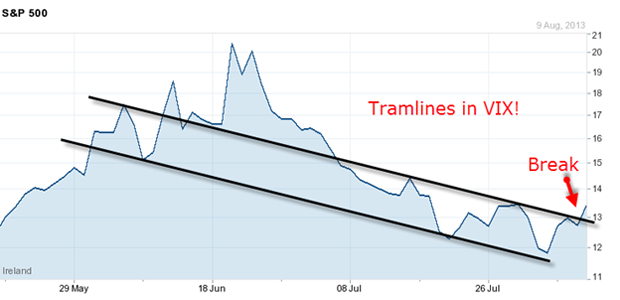
The VIX is the 'fear index'. Low readings indicate complacency and high readings show fear. Very high readings mean that selling panic is in the air. We saw that in 2008 2009.
Here is the VIX chart I took on 9 August:

I have a nice tramline pair and an upper tramline break. And note the five-wave pattern to the chart from the 20 high. This pointed to a completed down wave with a rally phase coming. A rising VIX indicates a falling market.
This was another signal that the great bull market was likely ending.
Recently, the VIX has rallied to the 15 level. The fear level is increasing.
This means that the short side is the one to trade in many markets.
Has the change in trend affected the long/short positions of the futures players? Here is the latest commitments of traders (COT) data as of 13 August:
| ($5 x DJIA Index) | Row 0 - Cell 1 | Row 0 - Cell 2 | Row 0 - Cell 3 | Open interest: 127,247 | ||||
| Commitments | ||||||||
| 49,652 | 6,692 | 551 | 56,367 | 106,404 | 106,570 | 113,647 | 20,677 | 13,600 |
| Changes from 08/06/13 (Change in open interest: 4,566) | ||||||||
| 5,213 | -647 | -159 | -3,947 | 6,391 | 1,107 | 5,585 | 3,459 | -1,019 |
| Percent of open in terest for each category of traders | ||||||||
| 39.0 | 5.3 | 0.4 | 44.3 | 83.6 | 83.8 | 89.3 | 16.2 | 10.7 |
| Number of traders in each category (Total traders: 100) | ||||||||
| 38 | 12 | 5 | 34 | 22 | 74 | 37 | Row 8 - Cell 7 | Row 8 - Cell 8 |
The hedge funds (non-commercials) added to their long positions as did the small specs. They are buying the dips! Old habits die hard. And they have not yet caught the fear shown by the rising VIX.
And the hedgies are almost 7.5-to-1 bullish an extreme one-sidedness.
The boat, when it capsizes, promises to take many casualties.
Get the latest financial news, insights and expert analysis from our award-winning MoneyWeek team, to help you understand what really matters when it comes to your finances.
John is is a British-born lapsed PhD physicist, who previously worked for Nasa on the Mars exploration team. He is a former commodity trading advisor with the US Commodities Futures Trading Commission, and worked in a boutique futures house in California in the 1980s.
He was a partner in one of the first futures newsletter advisory services, based in Washington DC, specialising in pork bellies and currencies. John is primarily a chart-reading trader, having cut his trading teeth in the days before PCs.
As well as his work in the financial world, he has launched, run and sold several 'real' businesses producing 'real' products.
-
 Average UK house price reaches £300,000 for first time, Halifax says
While the average house price has topped £300k, regional disparities still remain, Halifax finds.
-
 Barings Emerging Europe trust bounces back from Russia woes
Barings Emerging Europe trust has added the Middle East and Africa to its mandate, delivering a strong recovery, says Max King