Is gold about to rally?
Sentiment in the gold market is rapidly turning bearish. So, is it time to trade from the long side? John C Burford examines the charts for clues.
Get the latest financial news, insights and expert analysis from our award-winning MoneyWeek team, to help you understand what really matters when it comes to your finances.
You are now subscribed
Your newsletter sign-up was successful
Want to add more newsletters?

Twice daily
MoneyWeek
Get the latest financial news, insights and expert analysis from our award-winning MoneyWeek team, to help you understand what really matters when it comes to your finances.

Four times a week
Look After My Bills
Sign up to our free money-saving newsletter, filled with the latest news and expert advice to help you find the best tips and deals for managing your bills. Start saving today!
I'm going to cover gold today, picking up from where I left off last Wednesday.
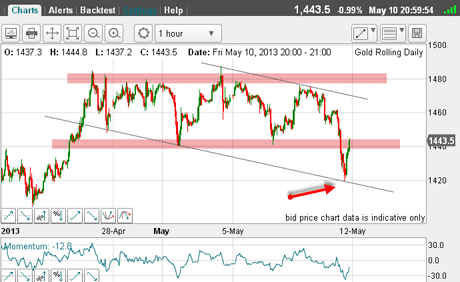
The market late last week dropped below the support level I had marked on the hourly chart, and then rallied late on Friday to test the underside of this level (see below chart).
Note that the low on Friday at $1,420 was the precise tramline target that was indicated from my excellent tramline pair I had drawn previously (red arrow).
MoneyWeek
Subscribe to MoneyWeek today and get your first six magazine issues absolutely FREE

Sign up to Money Morning
Don't miss the latest investment and personal finances news, market analysis, plus money-saving tips with our free twice-daily newsletter
Don't miss the latest investment and personal finances news, market analysis, plus money-saving tips with our free twice-daily newsletter
The upper tramline connects the spike highs and the lower one connects the spike lows.
(Click on the chart for a larger version)
Which proves that even with the notoriously spiky moves in gold, the market is definitely patterned. All markets are. And it is the trader's task to unlock these patterns so as to profit from the conclusions drawn.
And you can ignore any talk of efficient market theories'. Markets are not efficient in the manner the academic economists believe. There is no right' or equilibrium price for anything, be it gold, houses, or shoes. And in a dynamic market economy, such as we have, there is no such concept as equilibrium.
This concept is bandied about by politicians, who have even less grasp of economic reality than the economists themselves!
Just spending a few moments watching a tick chart of gold should convince anyone that prices are constantly changing as they respond to the waves of buy and sell orders, driven as they are by the sentiment swings of the traders.
What I attempt to do is to reduce the infinite number of variables that impact any market to a few time-tested basic concepts.
I encourage every trader to find their own basic variables that have proven their value. I use the momentum indicator extensively, but you may like Stochastics, or moving average convergence/divergence (MACD), for example.
One other point: I rarely use moving averages, as they have not helped me to generate profits consistently. The big disadvantage to me is that they are a seriously lagging indicator and I require as instant a signal as I can find.
My preference for divergences in momentum are as instant as I can find.
In other words, I like to keep it simple. But because most traders are constantly searching for something that can give them an edge, they take on board all kinds of weird and wonderful concepts, so that their charts look like a spaghetti factory floor after an explosion.
I urge you not to fall into this trap. Confusion is a poor mindset for trading.
When we are in competition with the smartest brains on the planet, we need a clear head and a clear strategy.
Also, I have yet to meet anyone who can trade the swings in gold based just on the fundamentals. So I pay no heed whatsoever to the chatter about supply and demand, or to central bank buying/selling, or what my Uncle Joe, who works for a bank, tells me about what the bank thinks.
In gold, I encourage all swing traders to just focus on the charts and sentiment readings. That's it.
Focus on the Elliott wave patterns
For instance, on Friday, the euro and many other major currencies were falling hard against the dollar. That would obviously tend to put pressure on gold and it responded by falling to the $1,420 level.
OK, now the market has rallied back to the underside of the resistance bar, where to now?
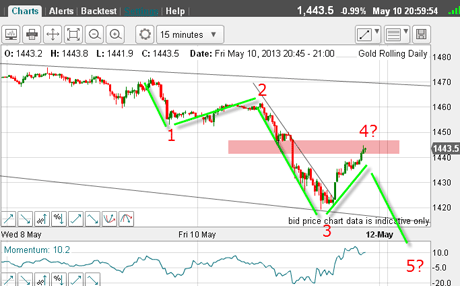
Let's zoom in on the 15-minute chart to look for clues:
(Click on the chart for a larger version)
I can count a clear Elliott wave pattern with the rally being wave 4. My wave 3 has the looks of a third wave, being long and strong (see the very low momentum reading at the low for strength of the move).
So the next move should be down in wave 5, which should take it below the wave 3 low at $1,420, as it likely will bounce off the resistance.
That is the percentage play, with a protective stop above $1,450 to limit damage if wrong.
But if this is wave 4, it could turn out to be very complex many fourth waves are. So, it is not necessary to make a new low in wave 5.
As an alternative scenario, the market will continue its rally perhaps in an A-B-C? and that would cancel out my Elliott wave count, since a move well above $1,450 would mean that wave 4 overlaps wave 1, and that is not allowed.
In this case, the decline off the $1,470 high would likely be a three-wave affair, which is counter-trend. This would imply a push above the $1,480 high.
So I have a clear outline of what I expect from my Elliott wave model and that is one of its most useful attributes. If the count is wrong, you will know very quickly so that you can cut your loss and move out of the way smartly.
The one sure way to lose money is to flounder around, not being able to decide what to do. But with a clear idea from the Elliott wave principles, you have complete confidence in knowing that if your count is correct, you can project further moves with accuracy.
And if you are wrong, you escape with a small loss and live to fight another day.
OK, if the market continues to rally instead, the next target is the upper tramline (see first chart) at the $1,460 area.
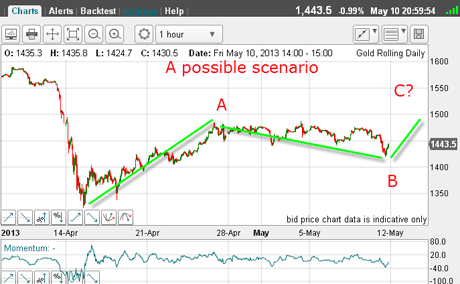
Pushing above that level would be interesting, as it would mean that a large A-B-C rally was unfolding, such as this:
(Click on the chart for a larger version)
The C wave would then push above $1,480 and on to the $1,500 area with help from massive short-covering.
There must be a huge pile of very tasty buy stops lying just above the highs at $1,480 for the professionals to gun for!
This scenario is a very real possibility, especially if we see a big tumble in the stock markets and I shall get back to the Dow later this week, when hopefully, we shall see some interesting developments.
After all, this is what I wrote last Wednesday: "So my best guess this morning is that we should see a minor B wave down off the $1,480 high, leading to a rally above $1,480 to one of the Fibonacci levels before making a final turn down."
And the latest commitments of traders (COT) data could support such a move:
| OPEN INTEREST: 437,931 | ||||||||
| COMMITMENTS | ||||||||
| 189,343 | 99,920 | 23,851 | 186,671 | 274,390 | 399,865 | 398,161 | 38,066 | 39,770 |
| CHANGES FROM04/30/13 (CHANGE IN OPEN INTEREST: 16,844) | ||||||||
| -3,967 | 3,662 | 3,736 | 16,460 | 8,616 | 16,229 | 16,014 | 615 | 830 |
| PERCENT OF OPEN INTEREST FOR EACH CATEGORY OF TRADERS | ||||||||
| 43.2 | 22.8 | 5.4 | 42.6 | 62.7 | 91.3 | 90.9 | 8.7 | 9.1 |
| NUMBER OF TRADERS IN EACH CATEGORY (TOTAL TRADERS: 309) | ||||||||
| 127 | 103 | 74 | 61 | 52 | 220 | 202 | Row 8 - Cell 7 | Row 8 - Cell 8 |
This points to the hedgies, who are primarily trend-followers, as being much more vulnerable to a further short squeeze.
But the odds at the moment favour a move off the $1,445 level reached on Friday's close. Whether such a down move proves decisive is a problematic question.
So these are the cross-currents, as I see them.
And any short trade I initiate will carry a very tight stop.
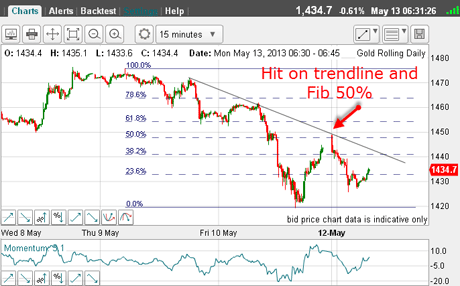
Update: All of the charts above were taken on the weekend and this morning, we have the bounce off the resistance bar:
(Click on the chart for a larger version)
The opening rally late on Sunday took gold to where the trendline meets the Fibonacci 50% retrace. If you were up late on Sunday, this was a good place to enter a short with a stop above $1,450.
The market is dipping $25 off that high as I write, and short-term trades could be cashed in.
It appears my first scenario is playing out so far. But a push above my trendline at $1,440 could prove very interesting. I have moved my stops now to break-even.
If you're a new reader, or need a reminder about some of the methods I refer to in my trades, then do have a look at my introductory videos:
The essentials of tramline trading Advanced tramline trading An introduction to Elliott wave theory Advanced trading with Elliott waves Trading with Fibonacci levels Trading with 'momentum' Putting it all together
Don't miss my next trading insight. To receive all my spread betting blog posts by email, as soon as I've written them, just sign up here . If you have any queries regarding MoneyWeek Trader, please contact us here.
Get the latest financial news, insights and expert analysis from our award-winning MoneyWeek team, to help you understand what really matters when it comes to your finances.
John is is a British-born lapsed PhD physicist, who previously worked for Nasa on the Mars exploration team. He is a former commodity trading advisor with the US Commodities Futures Trading Commission, and worked in a boutique futures house in California in the 1980s.
He was a partner in one of the first futures newsletter advisory services, based in Washington DC, specialising in pork bellies and currencies. John is primarily a chart-reading trader, having cut his trading teeth in the days before PCs.
As well as his work in the financial world, he has launched, run and sold several 'real' businesses producing 'real' products.
-
 MoneyWeek news quiz: Can you get smart meter compensation?
Smart meter compensation rules, Premium Bonds winners, and the Bank of England’s latest base rate decision all made the news this week. How closely were you following it?
-
 Adventures in Saudi Arabia
Travel The kingdom of Saudi Arabia in the Middle East is rich in undiscovered natural beauty. Get there before everybody else does, says Merryn Somerset Webb