Gold’s amazing counter-trend rally
Since the spectacular crash in the gold price, gold has been in rally mode. But now it's hit a critical juncture, can it push on higher? John C Burford examines the charts.
Get the latest financial news, insights and expert analysis from our award-winning MoneyWeek team, to help you understand what really matters when it comes to your finances.
You are now subscribed
Your newsletter sign-up was successful
Want to add more newsletters?

Twice daily
MoneyWeek
Get the latest financial news, insights and expert analysis from our award-winning MoneyWeek team, to help you understand what really matters when it comes to your finances.

Four times a week
Look After My Bills
Sign up to our free money-saving newsletter, filled with the latest news and expert advice to help you find the best tips and deals for managing your bills. Start saving today!
Back with the markets - I last covered gold on 24 April in the aftermath of the big crash. Since then, there have been lots of gold post-mortems and dark conspiracy theories.
Frankly, I only read that stuff for its entertainment value. Trying to pick over the entrails of this event to learn anything is a pointless exercise. It's pointless because it assumes that outside events are what drive markets.
Yes, in the very short term, some outside developments can move markets. But they rarely change the main trend.
MoneyWeek
Subscribe to MoneyWeek today and get your first six magazine issues absolutely FREE

Sign up to Money Morning
Don't miss the latest investment and personal finances news, market analysis, plus money-saving tips with our free twice-daily newsletter
Don't miss the latest investment and personal finances news, market analysis, plus money-saving tips with our free twice-daily newsletter
Markets are moved by the invisible hand of sentiment, and the waves of sentiment are reflected in the waves on the price chart. And these waves are very often described by the Elliott wave theory sometimes, with startling clarity.
My advice to traders is this: only spend your valuable time discovering ways in which you can become a better trader. By this I mean, making more profit on your winning trades and losing less on your losers.
One way do this is to study market sentiment changes by scanning headlines and following the commitments of traders(COT) data.
A trader's motivation is not primarily to be proven right in their market view. Their sole aim is to make money and that can mean taking a bullish stance for one trade and then a bearish stance for the next one.
Gold is at the mercy of short-term swing traders
But since the crash, many of these have battened down the hatches, and I have noted that many are paying less attention to that market than before.
This leaves the market dominated by the short-term traders - and so, subject to wide swings up and down. I noted that both bulls and bears will be punished in these swings.
Let's now see how the market has progressed:

(Click on the chart for a larger version)
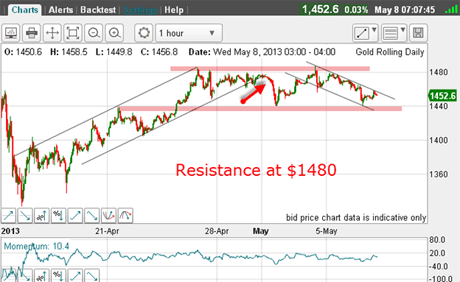
From the 16 April low, the market has been in a broad counter-trend rally and has bumped up against the $1,480 level.
This level is a precise Fibonacci one third, or 33.3% of the move down off the $1,800 high of last October.
Remember, although you may not have this level in your Fibonacci tool kit, it is still a valid projection, as the numbers one and three are both Fibonacci numbers.
The first rally in late April followed broadly my tramlines with a lower tramline break marked by the red arrow.
That was a possible start to a resumption of the downtrend and a short trade was indicated, and I'm sure many newly-converted bears became excited at this possibility and took short positions.
But it was not to be. The market sprung yet another surprise by rallying back to the $1,480 level, trapping many bears.
And now, since then, the market has been trading between the two pink bars of support and resistance.
What I look for when in these periods of consolidation is a break-out of this zone, which is between $1,480 and $1,440.
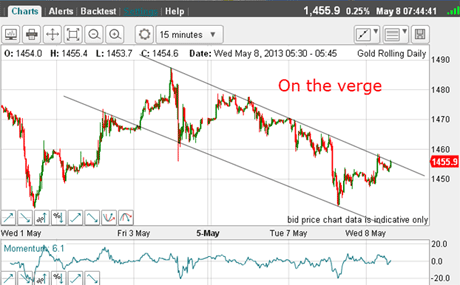
But on the right of the chart, I have a new tramline pair. Let's zoom in on this, as it could offer me some clues as to near-term direction:

(Click on the chart for a larger version)
Yesterday, the market again tested the lower boundary at $1,440, and this morning is finding support by rallying back to the $1,455 area.
And as I write, the market is testing my upper tramline, which I regard as a solid one with many touch points.
A rally above this line should herald a charge upwards perhaps back to the $1,480 area again. That is an obvious signal for a long trade, using a close stop of course.
OK, what if the $1,480 resistance can be taken out? What is a possible target?
Let's go back to the long-range chart again:

(Click on the chart for a larger version)
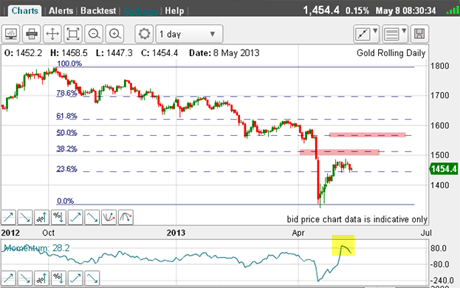
The next Fibonacci levels lie at $1,500 and then $1,560 and these are both possible.
But gazing at the very high momentum reading (yellow bar), the rally appears over-stretched here. This wide swing in momentum normally occurs following a big plunge, though.
Studying the daily chart above, it is clear that in the bear market off the $1,800 top, all relief rallies off the lows have had A-B-C forms. Why not satisfy yourself of this?
If history repeats, then we should expect the same form in the current rally and we only have one leg up, so far.
So my best guess this morning is that we should see a minor B wave down off the $1,480 high, leading to a rally above $1,480 to one of the Fibonacci levels before making a final turn down.
And if the market can poke above my tramline on the 15-minute chart, that could do it!
But a failure at this tramline would mean more work is needed before a break-out can occur.
But one factor in the poor sentiment in gold is the surging stock markets. When the markets are in risk on' mode, why hold gold?
But if stocks make a major turn as I suspect they will soon the gold bears will begin short covering in droves. And we should then see the continuation of that rally.
If you're a new reader, or need a reminder about some of the methods I refer to in my trades, then do have a look at my introductory videos:
The essentials of tramline trading Advanced tramline trading An introduction to Elliott wave theory Advanced trading with Elliott waves Trading with Fibonacci levels Trading with 'momentum' Putting it all together
Don't miss my next trading insight. To receive all my spread betting blog posts by email, as soon as I've written them, just sign up here . If you have any queries regarding MoneyWeek Trader, please contact us here.
Get the latest financial news, insights and expert analysis from our award-winning MoneyWeek team, to help you understand what really matters when it comes to your finances.
John is is a British-born lapsed PhD physicist, who previously worked for Nasa on the Mars exploration team. He is a former commodity trading advisor with the US Commodities Futures Trading Commission, and worked in a boutique futures house in California in the 1980s.
He was a partner in one of the first futures newsletter advisory services, based in Washington DC, specialising in pork bellies and currencies. John is primarily a chart-reading trader, having cut his trading teeth in the days before PCs.
As well as his work in the financial world, he has launched, run and sold several 'real' businesses producing 'real' products.
-
 MoneyWeek Talks: The funds to choose in 2026
Podcast Fidelity's Tom Stevenson reveals his top three funds for 2026 for your ISA or self-invested personal pension
-
 Three companies with deep economic moats to buy now
Opinion An economic moat can underpin a company's future returns. Here, Imran Sattar, portfolio manager at Edinburgh Investment Trust, selects three stocks to buy now