You are now subscribed
Your newsletter sign-up was successful
Want to add more newsletters?

Twice daily
MoneyWeek
Get the latest financial news, insights and expert analysis from our award-winning MoneyWeek team, to help you understand what really matters when it comes to your finances.

Four times a week
Look After My Bills
Sign up to our free money-saving newsletter, filled with the latest news and expert advice to help you find the best tips and deals for managing your bills. Start saving today!
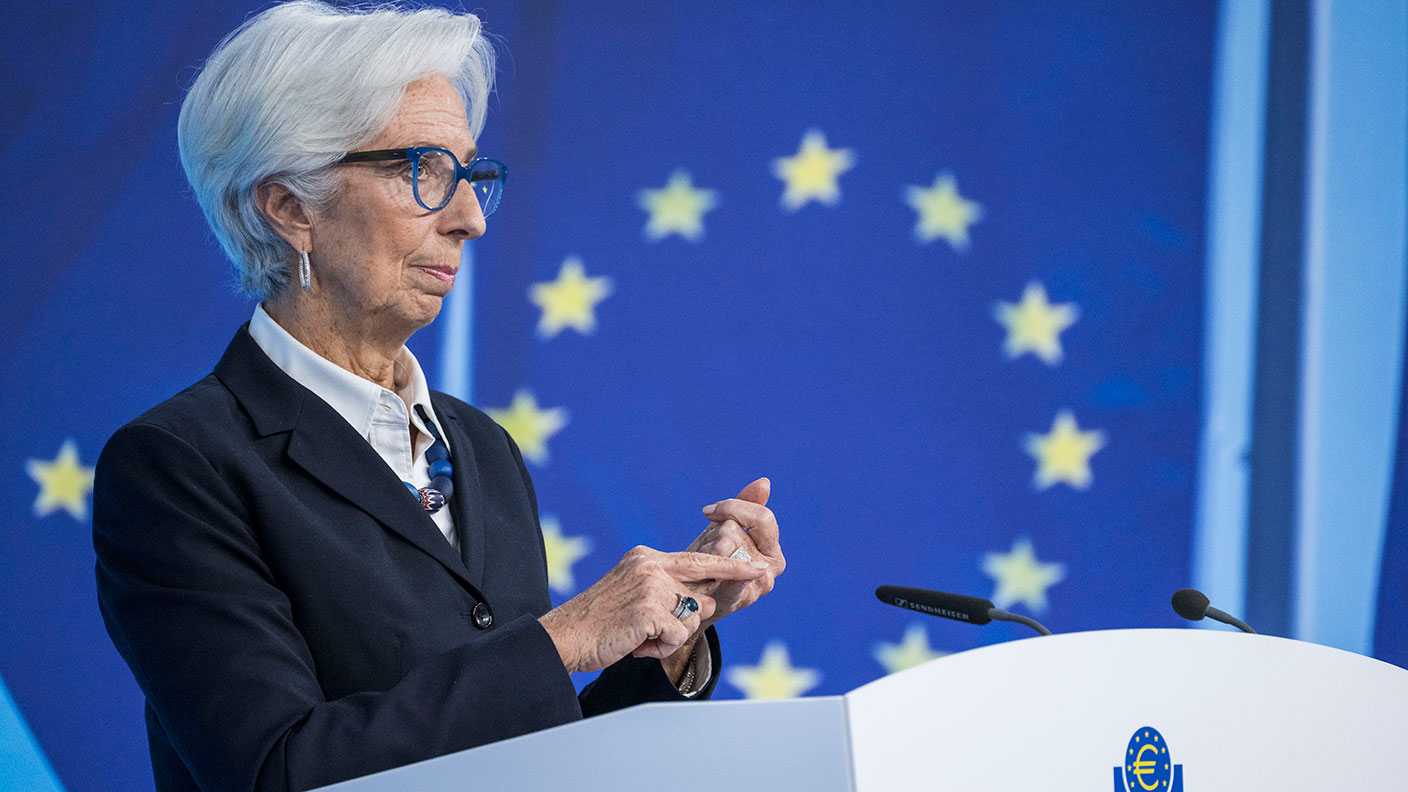
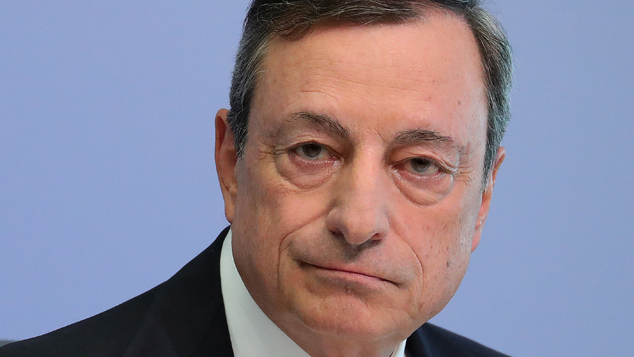
The euro has strengthened in recent days by around four cents. Was that the result Mario Draghi was looking for in order to achieve his stated aim of boosting the EZ' inflation rate when he launched his Big Bazooka last week? Well, with a stronger euro, imports become cheaper to buy and instead, the deflationary pressure is intensified, not weakened. Oops.
But of course, my readers were fully prepared for this seemingly perverse market reaction. Logically, the prospect of having a huge pile of euros fresh off the ECB printing press would weaken it. But we know that logic has little bearing in the markets when everybody believes it.
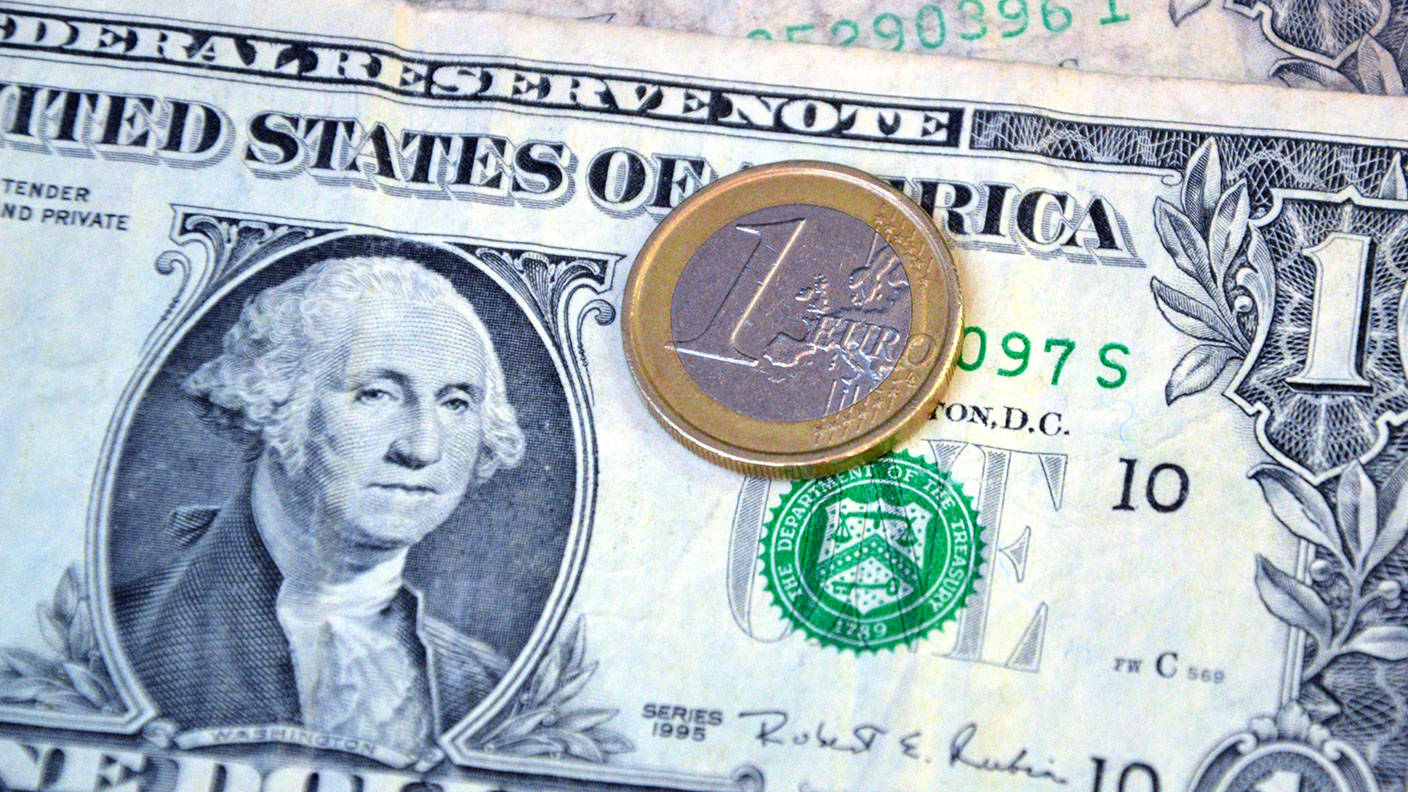
Because all currencies are connected as a result of trade and speculation, what was the effect on cable (GBP/USD)? After all, with the UK outside the eurozone, Draghi's moves should not have too much effect on cable at least in theory.
MoneyWeek
Subscribe to MoneyWeek today and get your first six magazine issues absolutely FREE

Sign up to Money Morning
Don't miss the latest investment and personal finances news, market analysis, plus money-saving tips with our free twice-daily newsletter
Don't miss the latest investment and personal finances news, market analysis, plus money-saving tips with our free twice-daily newsletter
But of course, the EUR/GBP rate is a very important one because of the massive cross-border trade volumes.
So did cable rally alongside the euro? It was a result I was looking for because the waves in the two charts suggested a rally was at hand. That put me on high alert for a buy signal starting last Wednesday.
Below is the chart I took on Tuesday. The market did accompany the euro in the Draghi bounce with a sharp move up, but I wanted to see what form the inevitable pull-back reaction to it would be. The structure of the pull-back would tell me a lot about the prospects for a continuation of the rally (or not).

| CONTRACTS OF £62,500 | Open interest: 210,983 | |||||||
| Commitments | ||||||||
| 38,412 | 66,263 | 16,857 | 137,134 | 88,700 | 192,403 | 171,821 | 18,580 | 39,162 |
| Changes from 24/11/15 (Change in open interest: 12,920) | ||||||||
| 6,008 | 1,480 | -790 | 8,075 | 10,997 | 13,292 | 11,685 | -372 | 1,235 |
| Percent of open interest for each category of trader | ||||||||
| 18.2 | 31.4 | 8.0 | 65.0 | 42.0 | 91.2 | 81.4 | 8.8 | 18.6 |
| Number of traders in each category (Total traders: 269) | ||||||||
| 28 | 47 | 25 | 28 | 39 | 74 | 93 | Row 8 - Cell 7 | Row 8 - Cell 8 |
Although the specs were lined up about 2:1 bearish, the hedge funds had the foresight to reduce their short bets, proving they don't always get it wrong at market turns!
Of course, I am discussing the activity of the entire group of hedge funds in aggregate; there are always some that buck the trend of the majority.
I knew a correction was coming but what form would it take?
And that is why I wanted to see what form the pull-back would take it could tell me a lot about the prospects for a more substantial rally phase, or whether the market was headed lower.
The initial move up was either wave 1 or an A wave, and the dip was either a wave 2 or a B wave. In either case, a rally was coming I had to look for a long entry.
The only event that could spoil this picture was a move to new lows.
I noted that the pull-back looked corrective because the mini waves overlapped in a stair-step fashion, which is typical of a correction.
So, armed with this observation, I looked for a long trade either at the Fibonacci 62% or the 78% level (which was my line in the sand) and either would provide a low-risk opportunity. Remember, I am only interested in low-risk trades where I can place a close protective stop.
Below is the result of my analysis. The Fibonacci 78% level held and the market proceeded to take off like a rocket (in the same manner as the Draghi bounce). This action is impulsive, and suggests there is more to come. My trade was entered near the 1.50 level:

But for now, I cannot rule out either of the two labels are we in a third or a in C wave?
Note that the rally hit the Fibonacci 50% level at 1.52 a natural place to take at least partial profits of around 200 pips using my split-bet strategy. And the large momentum divergence is a clear warning that the C wave interpretation is very much in play. With that in mind, I have moved my protective stop on the remaining position to break even.
I always keep an eye on the big picture and here it is:

The correction to the major bear market from April to the high in June and now to the recent low is very complex and a nightmare for Elliott wave technicians!
But I can say that the decline off the summer's highs appears very corrective with highly overlapping waves (see above), which could indicate a more substantial rally phase is in prospect.
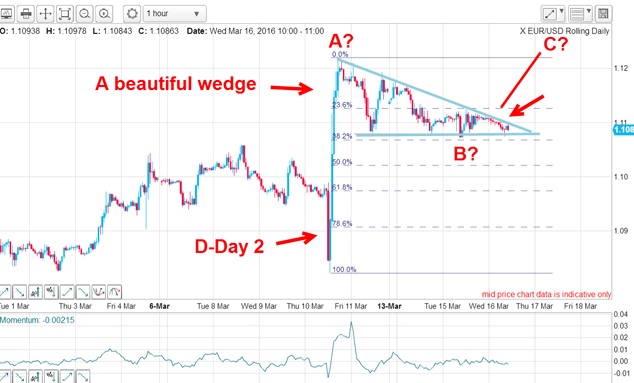
Also, there is a budding wedge pattern forming and of the upper line can be breached, a rally would be on. Incidentally, next week I will show some great recent examples of wedges and how you can trade them.
Note the large positive momentum divergence another clue that a major turn may be at hand where a test of the summer's highs is a distinct possibility.
I am prepared for anything I have a banked profit and a break-even trade that is also in profit. And that is all a trader could possibly want!
-
 Average UK house price reaches £300,000 for first time, Halifax says
While the average house price has topped £300k, regional disparities still remain, Halifax finds.
-
 Barings Emerging Europe trust bounces back from Russia woes
Barings Emerging Europe trust has added the Middle East and Africa to its mandate, delivering a strong recovery, says Max King


-
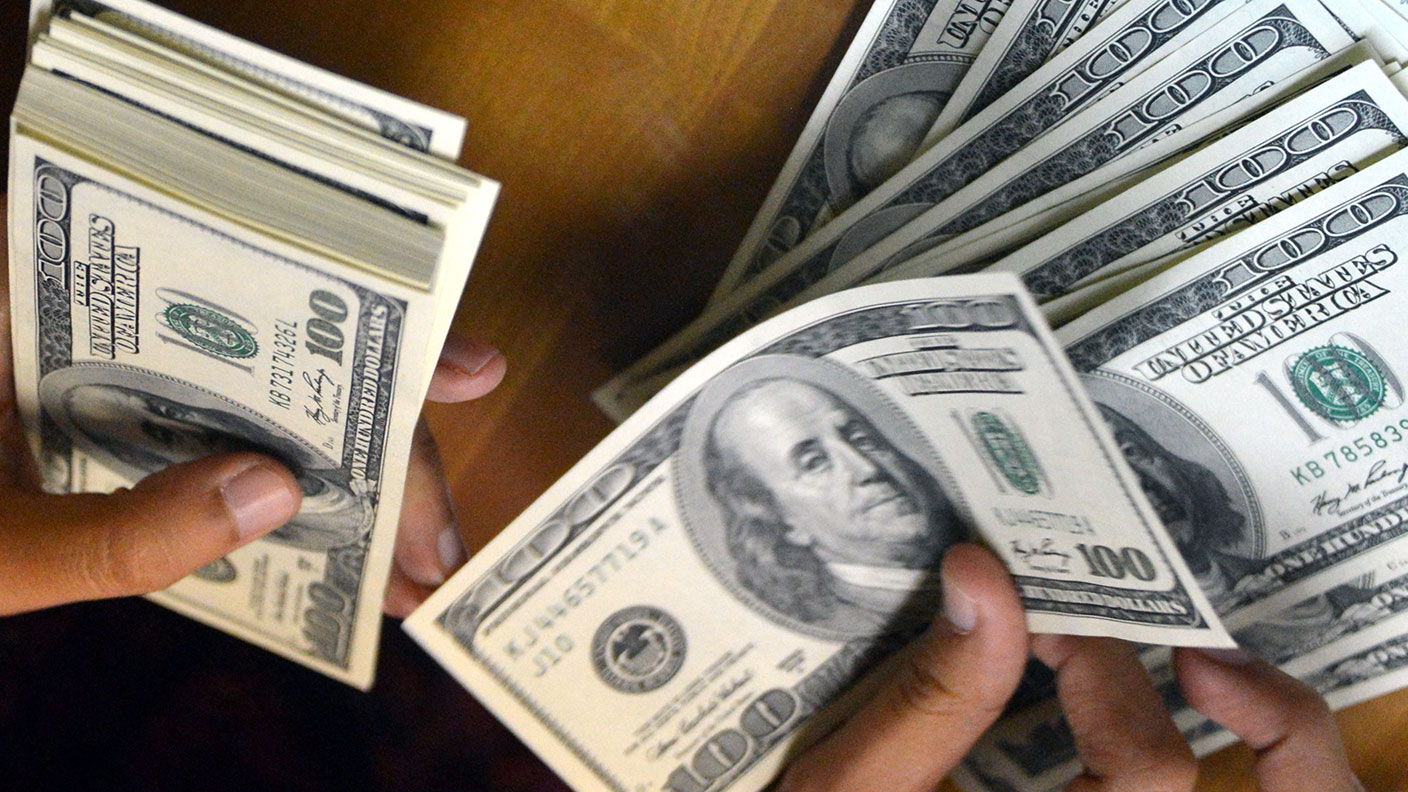
 Investors dash into the US dollar
News The value of the US dollar has soared as investors pile in. The euro has hit parity, while the Japanese yen and the Swedish krona have fared even worse.
-
 Could a stronger euro bring relief to global markets?
Analysis The European Central Bank is set to end its negative interest rate policy. That should bring some relief to markets, says John Stepek. Here’s why.
-
 A weakening US dollar is good news for markets – but will it continue?
Opinion The US dollar – the most important currency in the world – is on the slide. And that's good news for the stockmarket rally. John Stepek looks at what could derail things.
-
 How the US dollar standard is now suffocating the global economy
News In times of crisis, everyone wants cash. But not just any cash – they want the US dollar. John Stepek explains why the rush for dollars is putting a big dent in an already fragile global economy.
-
 The pound could hit parity with the euro – but if it does, buy it
Features Anyone visiting the continent this summer will have been in for a rude shock at the cash till, says Dominic Frisby. But the pound won't stay down forever.
-
 Gold’s rally should continue
Features Matthew Partridge looks at where the gold price is heading next, and what that means for your online trading.
-
 Prudent trades in Prudential
Features John C Burford shows how his trading methods can be used for more than just indices and currencies. They work for large-cap shares too.
-
 Did you find the path of least resistance in EUR/USD?
Features John C Burford outlines a trade in the euro vs the dollar in the wake of the US Federal Reserve’s most recent announcement.


