Gold is breaking above my tramline
Gold has overcome one level of resistance. Can it reach the second - or even third? John C Burford uses his trading methods to search the charts for clues.
Get the latest financial news, insights and expert analysis from our award-winning MoneyWeek team, to help you understand what really matters when it comes to your finances.
You are now subscribed
Your newsletter sign-up was successful
Want to add more newsletters?

Twice daily
MoneyWeek
Get the latest financial news, insights and expert analysis from our award-winning MoneyWeek team, to help you understand what really matters when it comes to your finances.

Four times a week
Look After My Bills
Sign up to our free money-saving newsletter, filled with the latest news and expert advice to help you find the best tips and deals for managing your bills. Start saving today!
I'm seeing important developments in all three of my favourite markets: the EUR/USD, the Dow, and gold. I'm spoiled for choice today!
But since gold is always popular with readers, I'm going to kick off this week by looking at that.
Gold is trading this morning in the critical $1,650 $1,660 zone, which I highlighted in my lastpost on Wednesday.
MoneyWeek
Subscribe to MoneyWeek today and get your first six magazine issues absolutely FREE

Sign up to Money Morning
Don't miss the latest investment and personal finances news, market analysis, plus money-saving tips with our free twice-daily newsletter
Don't miss the latest investment and personal finances news, market analysis, plus money-saving tips with our free twice-daily newsletter
And the charts I have for you today show again how powerful these tramlines can be.
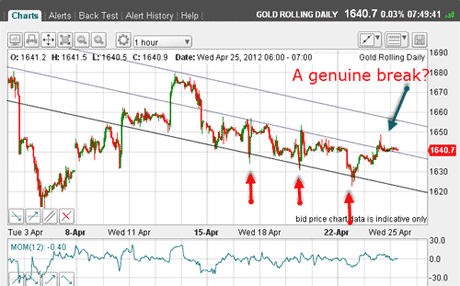
Recall from Wednesday that my reading at the time was to favour a push up from the $1,640 area in a genuine tramline break. This was the situation then:

(Click on the chart for a larger version)
The market had already spiked above the centre tramline. But remember, I was on the alert that it may have been a head fake', as were the three downward spikes below the lowest tramline as marked by my red arrows.
Longer-term chart shows gold is in a downtrend
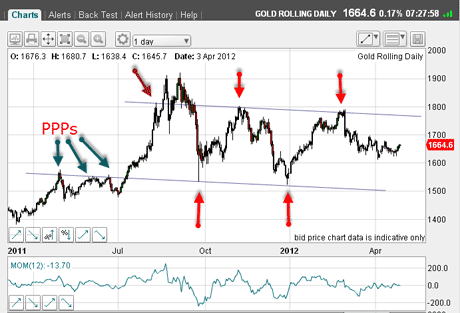
As you know, I like to keep one eye on the longer-range charts, especially when a tramline is being challenged. Here is the daily chart going back to the summer:

(Click on the chart for a larger version)
If you've been reading myposts fora while, you'll know I've been a gold bear since the $1,920 highs were made back in late summer, and I have not changed my stance.
Just a glance at the above chart shows that the market is in a downtrend since the $1,920 high. We have a series of lower highs and lower lows (marked by the red arrows) the very definition of a downtrend.
But that does not prevent me from trading the long side! If my charts indicate a trade, I will tend to take it, even if it does violate my long-term stance. After all, I understand that my bearish view could be wrong, and that a new high above $1,920 could occur within weeks.
Trader tip: Always remember, anything is possible in the markets, and it pays to be humble and flexible!
But just admire the tramlines I have drawn on that chart above. The upper one passes right across the two major peaks and across the minor peak marked by the brown arrow.
The real beauty, though, is my lower line. I have an unusually large number (three) of prior pivot points (PPPs) and the two major lows (red arrows) were achieved in sharp spikes.
As I have mentioned before, trading gold can be treacherous as these spikes occur very quickly and are gone before you know it. Trading near them requires constant attention and discipline.
What I have now is a major tramline pair with the tramlines about $300 apart. Unless something dramatic occurs, these tramlines should continue to operate as major support to declines and resistance to rallies, as they have since September.
So this becomes my long-term roadmap.
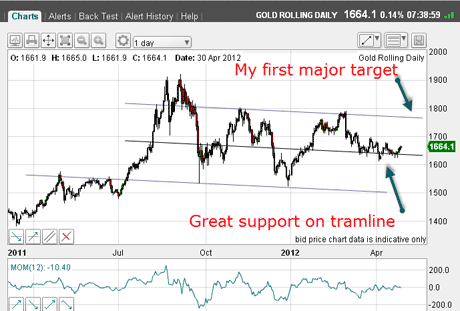
Of course, for trading signals, I require more fine-tuning and within my two tramlines, I can draw a central one:

(Click on the chart for a larger version)
The recent decline to the $1,625 area was halted on this tramline. Since then, the market is rallying and thus my first major target is the upper tramline in the $1,760 area.
But let's zoom in a little, by returning to the hourly chart:

(Click on the chart for a larger version)
Using Fibonacci to find targets for a trade
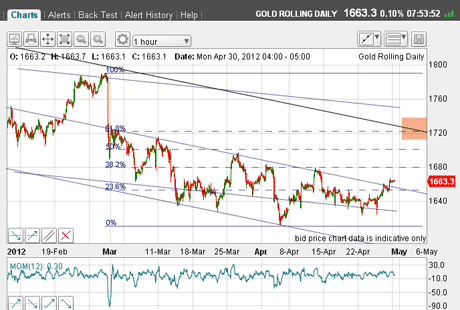
The market has cleanly broken above my central tramline and is heading towards the Fibonacci levels I have drawn in.
The first one is the 38% level where the previous high at $1,680 is located.How convenient!
If this resistance can be overcome, the next target is the Fibonacci 50% level at $1,700. Beyond that lies the 62% level where it meets the down-sloping third tramline in the $1,720 area as marked by my pink bar.
So those will be my markers over the short term.
Naturally, a break back below the centre tramline in the $1,650 area would be problematic for my immediate bullish cause. So I'll be thinking about protective stops below $1,650.
But for now, the gold market is in synch with the Dow and the EUR/USD. This is an altogether satisfactory situation, as it is the waves of liquidity that are currently driving asset markets.
If you're a new reader, or need a reminder about some of the methods I refer to in my trades, then do have a look at my introductory videos:
The essentials of tramline trading
An introduction to Elliott wave theory
Advanced trading with Elliott waves
Don't miss my next trading insight. To receive all my spread betting blog posts by email, as soon as I've written them, just sign up here .
Get the latest financial news, insights and expert analysis from our award-winning MoneyWeek team, to help you understand what really matters when it comes to your finances.
John is is a British-born lapsed PhD physicist, who previously worked for Nasa on the Mars exploration team. He is a former commodity trading advisor with the US Commodities Futures Trading Commission, and worked in a boutique futures house in California in the 1980s.
He was a partner in one of the first futures newsletter advisory services, based in Washington DC, specialising in pork bellies and currencies. John is primarily a chart-reading trader, having cut his trading teeth in the days before PCs.
As well as his work in the financial world, he has launched, run and sold several 'real' businesses producing 'real' products.
-
 Average UK house price reaches £300,000 for first time, Halifax says
While the average house price has topped £300k, regional disparities still remain, Halifax finds.
-
 Barings Emerging Europe trust bounces back from Russia woes
Barings Emerging Europe trust has added the Middle East and Africa to its mandate, delivering a strong recovery, says Max King