If this line breaks, expect fireworks in gold
Gold looks set for a rally that could trigger a burst of buy orders, says John C Burford. If that happens, who knows how high gold could go?
Get the latest financial news, insights and expert analysis from our award-winning MoneyWeek team, to help you understand what really matters when it comes to your finances.
You are now subscribed
Your newsletter sign-up was successful
Want to add more newsletters?

Twice daily
MoneyWeek
Get the latest financial news, insights and expert analysis from our award-winning MoneyWeek team, to help you understand what really matters when it comes to your finances.

Four times a week
Look After My Bills
Sign up to our free money-saving newsletter, filled with the latest news and expert advice to help you find the best tips and deals for managing your bills. Start saving today!
Remember, I'm not giving you live trade advice in these posts.
What I'm trying to do is show you how you can use the methods I've developed to consistently profit from the markets.
One of my favourite markets to trade is gold and it's giving us some great lessons in tramline trading today.
MoneyWeek
Subscribe to MoneyWeek today and get your first six magazine issues absolutely FREE

Sign up to Money Morning
Don't miss the latest investment and personal finances news, market analysis, plus money-saving tips with our free twice-daily newsletter
Don't miss the latest investment and personal finances news, market analysis, plus money-saving tips with our free twice-daily newsletter
It could be set for a big move as I'll show you a little later.
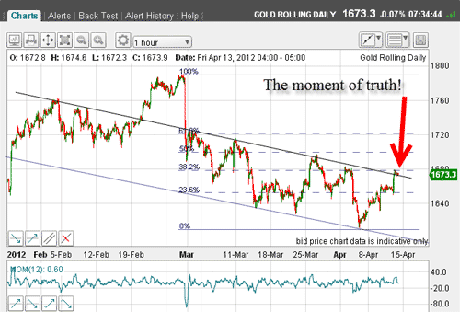
When I last looked at gold on 13 April, the market had rallied to the $1,680 area and was pushing up against my upper tramline.
When a tramline is hit like this, the question in my mind is always: Will it break through or bounce off?
This was the situation back then:

(Click on the chart for a larger version)
Sadly, I have not yet discovered a fool-proof method for forecasting which outcome will occur! But there are often subtle clues.
One of the clues I look for is well illustrated in the above chart. Note that as the market rallied up to the upper tramline, momentum readings on the hourly chart were in the overbought' region.
To me, this indicates that much of the buying power was being spent on the way up and when the tramline was hit, that power was already drying up.
Of course, this is not a guarantee that the market could not find a bid and break the tramline perhaps on developments in related markets. But it is a good starting point.
Gold reverses on 'Turnaround Tuesday'
In fact, the market did respect the resistance of the tramline and fell back to the $1,625 area on Monday. Since then, it's been rallying again.
In fact, yesterday's rally illustrates a well-known effect called 'Turnaround Tuesday'. This describes the curious effect that whatever trend was going on Monday usually an extension of the previous week's trend the trend often reverses on Tuesday. Please don't ask me why. It's just something I've observed over the years.
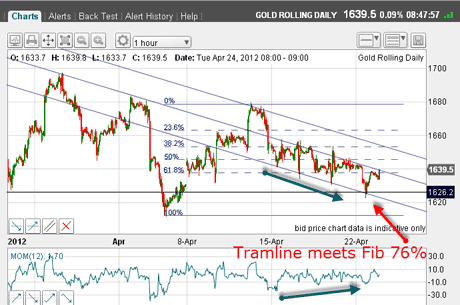
Anyway, with this action, I am now able to draw another set of tramlines on the hourly chart:

(Click on the chart for a larger version)
I took this chart yesterday as the market had hit not only my lower tramline, but also a Fibonacci 76% retrace of the big wave up from the 4 April low to the 12 April high. The 76% retrace is the black line at $1,626.
Trader tip: When the market is correcting a wave, put in your Fibonacci levels right away. Very often, the retrace will turn around at one of these levels, as it has done here.
OK, the market has rallied up to my central tramline. But how secure are my tramlines as drawn? That is always a consideration to me.
Going further back in time shows these are good tramlines
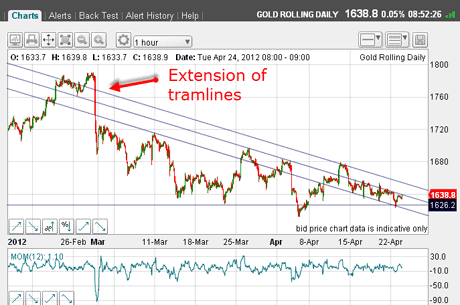
What I like to do in this respect is go back in time and see if my tramlines extend back to pass across significant highs and lows. The more touch points and the more distant spacing the better:

(Click on the chart for a larger version)
Lo and behold, my lines do indeed pass through highs and lows in late February and the major high on 9 March. I was very glad to see that pop up!
So as I write this morning, with the market still up against my central tramline in the $1,640 area, where is the market likely to head now?
Take another look at today's second chart. See how I have drawn in a positive momentum divergence of the action from mid-April (green arrows). What that's showing is that the momentum is not following the move down yet. This is potentially bullish, of course.
That adds a little spice to the mix! If the market can rally over the central tramline towards the $1,650 $1,660 zone, there should be big waves of buying.
Why do I say that? It's simply that, as I have noted before, there has been a shift in sentiment from manic bullishness to more bearishness, although the market still has a bullish bias.
That means the new shorts will have their protective buy-stops in this region (above recent highs) and the blue touch paper would be lit. Remember, this is the set-up I mentioned last time, but the market needed another dip first.
If gold breaks my upper tramline, it could move swiftly higher
Remember the old market saw: Markets exist to punish the majority! They do this by what I call head-faking. And we may have an example this morning:

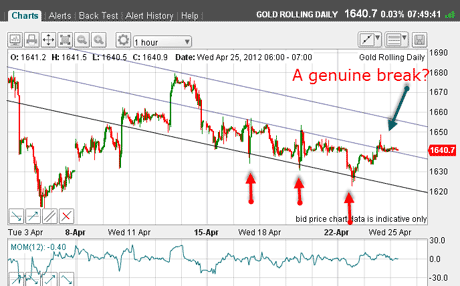
(Click on the chart for a larger version)
Was yesterday's move to the $1,648 level a head-fake or a genuine break? After all, the three pokes below my lowest tramline (red arrows) certainly were.
But this is typical behaviour for gold it is a very spiky market.
As I see it this morning, the odds do favour a rally towards my upper tramline. If this occurs, and my upper tramline is broken, then the buy stops at the $1,650 area will come into play and that would mean fireworks!
If you're a new reader, or need a reminder about some of the methods I refer to in my trades, then do have a look at my introductory videos:
The essentials of tramline trading
An introduction to Elliott wave theory
Advanced trading with Elliott waves
Don't miss my next trading insight. To receive all my spread betting blog posts by email, as soon as I've written them, just sign up here .
Get the latest financial news, insights and expert analysis from our award-winning MoneyWeek team, to help you understand what really matters when it comes to your finances.
John is is a British-born lapsed PhD physicist, who previously worked for Nasa on the Mars exploration team. He is a former commodity trading advisor with the US Commodities Futures Trading Commission, and worked in a boutique futures house in California in the 1980s.
He was a partner in one of the first futures newsletter advisory services, based in Washington DC, specialising in pork bellies and currencies. John is primarily a chart-reading trader, having cut his trading teeth in the days before PCs.
As well as his work in the financial world, he has launched, run and sold several 'real' businesses producing 'real' products.
-
 ISA fund and trust picks for every type of investor – which could work for you?
Whether you’re an ISA investor seeking reliable returns, looking to add a bit more risk to your portfolio or are new to investing, MoneyWeek asked the experts for funds and investment trusts you could consider in 2026
-
 The most popular fund sectors of 2025 as investor outflows continue
It was another difficult year for fund inflows but there are signs that investors are returning to the financial markets