Gold reaches a moment of truth – which way now?
Gold is moving up. But how high it goes depends on whether it can break through a powerful level of resistance, says John C Burford.
Get the latest financial news, insights and expert analysis from our award-winning MoneyWeek team, to help you understand what really matters when it comes to your finances.
You are now subscribed
Your newsletter sign-up was successful
Want to add more newsletters?

Twice daily
MoneyWeek
Get the latest financial news, insights and expert analysis from our award-winning MoneyWeek team, to help you understand what really matters when it comes to your finances.

Four times a week
Look After My Bills
Sign up to our free money-saving newsletter, filled with the latest news and expert advice to help you find the best tips and deals for managing your bills. Start saving today!
The last time I covered gold, I had taken some very juicy short-term profits from trading the down swings. And I was standing aside, waiting for the fog to clear.
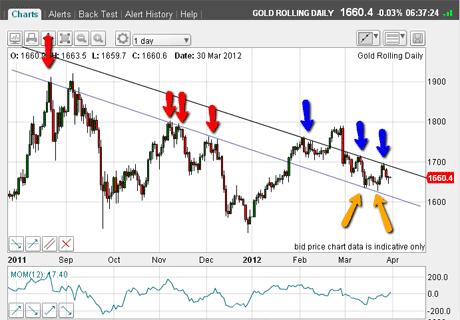
In that post, I had noted a superb tramline pair on the daily chart that stretched from last September. See chart below.
That pair has been containing all trading since early March and enabled me to time my winning trades. Take a good look at the tramlines on that chart, because this morning they are back in focus...
MoneyWeek
Subscribe to MoneyWeek today and get your first six magazine issues absolutely FREE

Sign up to Money Morning
Don't miss the latest investment and personal finances news, market analysis, plus money-saving tips with our free twice-daily newsletter
Don't miss the latest investment and personal finances news, market analysis, plus money-saving tips with our free twice-daily newsletter
When I wrote that issue, I was anticipating more downside action. But on 4 April, the market made a low at $1,612 right on the lower tramline.
This was also the Fibonacci 67% retrace of the huge swing from the 29 December $1,522 low to the 28 February $1,790 high. This was another reason to suspect a low was at hand!

(Click on the chart for a larger version)
And when I spotted a potential positive momentum divergence at that low, I began leaning more to the bullish side, but was unprepared to go long. That was a big mistake, I confess!
I had taken nice profits from the short side, and was not mentally ready to switch allegiance to the bullish cause. I had committed one of my trading sins!
Trader tip: This is where my bearish bias prevented me from taking a low-risk trade. The set-up was great the market was on the lower tramline, which had held all previous declines and there was a positive momentum divergence. So what stopped me? In a word fear of being wrong on a long trade, which had been the losing side up until then! In my 27 April workshop, I will focus on trader bias and what to do about it. Meanwhile, understand that we all have a bias (or three!) and a successful trader recognises theirs.
OK, no damage done, but no profit either. So let's analyse the charts as of this morning.
Gold reaches an area of strong resistance
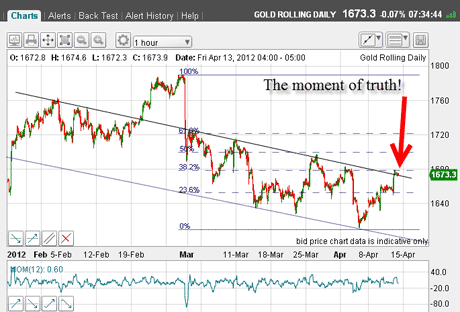
Here is the hourly chart, where I have drawn in the long-term tramline pair described above:

(Click on the chart for a larger version)
You can see how the market has rallied strongly off the 4 April low and is trading at the upper tramline in the $1,680 region which is also the Fibonacci 38% retrace of the latest large swing down. This area should represent strong resistance.
But tramlines are there to be broken! We have not had a tramline break since the big rally to my third tramline on 28 February (shown on the second chart in my 30 March post), just prior to the huge $100 plunge on 29 February. Will this be the time?
Note the major highs running along the upper tramline since early March.Recall last time, I had suggested that with the big 29 February plunge, more bears were coming out of hibernation.
This is what I said then: On this decline, I have the feeling that some traders have been emboldened to add to their short positions. I shall be monitoring the COT (Commitments of Traders) data closely. If true, we could see some large up-swings as those short positions are covered (ie, gold is bought).
These bears will have many protective buy-stops just above these highs. If the market can reach them, the buying will be explosive! And we are only a few dollars from the first peak at $1,695.
If I see a shift in the speculators' position from hugely long to less long, that would support my theory. So let's look at the latest COT report:
Gold - Commodities Exchange Inc.
Futures only positions as of 03/04/12
TABLE.ben-table TABLE {BORDER-BOTTOM: #2b1083 1px solid; BORDER-LEFT: #2b1083 1px solid; BORDER-TOP: #2b1083 1px solid; BORDER-RIGHT: #2b1083 1px solid}TH {TEXT-ALIGN: center; BORDER-LEFT: #a6a6c9 1px solid; PADDING-BOTTOM: 2px; PADDING-LEFT: 1px; PADDING-RIGHT: 1px; BACKGROUND: #2b1083; COLOR: white; FONT-SIZE: 0.8em; FONT-WEIGHT: bold; PADDING-TOP: 2px}TH.first {TEXT-ALIGN: left; BORDER-LEFT: 0px; PADDING-BOTTOM: 2px; PADDING-LEFT: 1px; PADDING-RIGHT: 1px; FONT-SIZE: 0.8em; PADDING-TOP: 2px}TR {BACKGROUND: #fff}TR.alt {BACKGROUND: #f6f5f9}TD {TEXT-ALIGN: center; BORDER-LEFT: #a6a6c9 1px solid; PADDING-BOTTOM: 2px; PADDING-LEFT: 1px; PADDING-RIGHT: 1px; COLOR: #000; FONT-SIZE: 0.8em; PADDING-TOP: 2px}TD.alt {BACKGROUND-COLOR: #f6f5f9}TD.bold {FONT-WEIGHT: bold}TD.first {TEXT-ALIGN: left}TD.left {TEXT-ALIGN: left}TD.bleft {TEXT-ALIGN: left; FONT-WEIGHT: bold}
| Long | Short | Spreads | Long | Short | Long | Short | Long | Short |
| (Contracts of 100 troy ozs) commitments | Open interest: 407,761 | |||||||
| 175,592 | 33,827 | 20,401 | 155,751 | 333,215 | 351,744 | 387,443 | 56,017 | 20,318 |
| Changes from 27/03/12 (Change in open interest: -9,543) | ||||||||
| -6,777 | -721 | -2,258 | 3,416 | -4,196 | -5,619 | -7,175 | -3,924 | -2,368 |
Yes, indeed. The non-commercials (large specs) have significantly reduced their long position. At the same time, the trade (commercials) have massively increased their long/reduced their short positions, so they are less convinced the market will decline. I consider the commercials the savviest of the bunch.
Watch this tramline for a potential upside break
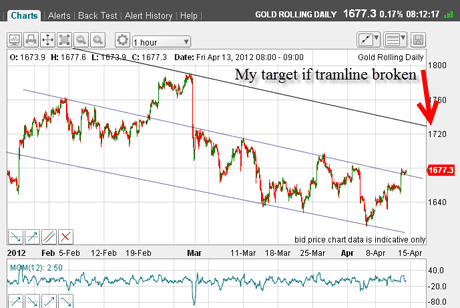
So, I am now thinking the unthinkable gold could rally above my upper tramline. If so, what is my target? Naturally, it is at my third tramline in the $1,720 region which is also the Fibonacci 62% retrace:

(Click on the chart for a larger version)
What a terrific potential set-up. But first, the current resistance must be broken.This morning, we have a slight overshoot of the tramline, that's all.
Will gold break through the centre tramline and head towards the third tramline? Or will it be contained in the channel where all the trading has happened since the start of March?
The matter will be resolved very soon perhaps today? We'll see
If you're a new reader, or need a reminder about some of the methods I refer to in my trades, then do have a look at my introductory videos:
The essentials of tramline trading
An introduction to Elliott wave theory
Advanced trading with Elliott waves
Don't miss my next trading insight. To receive all my spread betting blog posts by email, as soon as I've written them, just sign up here .
Get the latest financial news, insights and expert analysis from our award-winning MoneyWeek team, to help you understand what really matters when it comes to your finances.
John is is a British-born lapsed PhD physicist, who previously worked for Nasa on the Mars exploration team. He is a former commodity trading advisor with the US Commodities Futures Trading Commission, and worked in a boutique futures house in California in the 1980s.
He was a partner in one of the first futures newsletter advisory services, based in Washington DC, specialising in pork bellies and currencies. John is primarily a chart-reading trader, having cut his trading teeth in the days before PCs.
As well as his work in the financial world, he has launched, run and sold several 'real' businesses producing 'real' products.
-
 UK interest rates live: rates held at 3.75%
The Bank of England’s Monetary Policy Committee (MPC) met today to decide UK interest rates, and voted to hold rates at their current level
-
 MoneyWeek Talks: The funds to choose in 2026
Podcast Fidelity's Tom Stevenson reveals his top three funds for 2026 for your ISA or self-invested personal pension