What today’s charts tell me to do about gold
Markets are anything but random, says John C Burford. Here he studies the charts using his tramlines method to find out where gold is heading to next.
Get the latest financial news, insights and expert analysis from our award-winning MoneyWeek team, to help you understand what really matters when it comes to your finances.
You are now subscribed
Your newsletter sign-up was successful
Want to add more newsletters?

Twice daily
MoneyWeek
Get the latest financial news, insights and expert analysis from our award-winning MoneyWeek team, to help you understand what really matters when it comes to your finances.

Four times a week
Look After My Bills
Sign up to our free money-saving newsletter, filled with the latest news and expert advice to help you find the best tips and deals for managing your bills. Start saving today!
I hope you're starting to see the power of tramlines as a trading tool.
On Wednesday, I showed how I was able to identify a superb short-selling entry in the FTSE. I'd done this from a tramline-derived target at 5,940.
My 5,940 target was hit precisely. And then the market turned sharply down. It was a great trade. In fact at one point yesterday, I had over 200 points profit in the bag in only two days.
MoneyWeek
Subscribe to MoneyWeek today and get your first six magazine issues absolutely FREE

Sign up to Money Morning
Don't miss the latest investment and personal finances news, market analysis, plus money-saving tips with our free twice-daily newsletter
Don't miss the latest investment and personal finances news, market analysis, plus money-saving tips with our free twice-daily newsletter
This morning, as promised, I want to show you something similar with gold. It's one of my favourite markets to trade and a great one for showing you what's possible using my methods.
I think you'll be amazed at the tramlines I've found and how they have helped me take profits from another $40 down move.
Using charts to anticipate and profit from market moves
On 16 March, the market was trying to consolidate the huge $100 decline of 29 February. This drop must have shaken up the gold bulls. In fact, I noted in the blogosphere a little more doubt creeping into the universally-accepted gold-to-the-moon story. A few very tentative bears were peeking out from behind the trees!
Trader tip: Isn't it amazing how it takes a sharp reversal to sow the doubt? Here in MoneyWeek Trader, I'm trying to show you that you can anticipate reversals and profit from them. It's of no use to a trader to jump on board after the move has occurred.
OK, I had made a short trade on this decline and I had taken a handy $100 per oz profit, or £1,000 on a £1 spread bet. I outlined this in my 16 March blog.
At the time, I noted that stocks and gold were diverging from their normal in-synch behaviour. That told me it was time to pause and be cautious.
I'm pleased to say that since then, the fog has cleared. The gold chart pattern is now in much better focus.
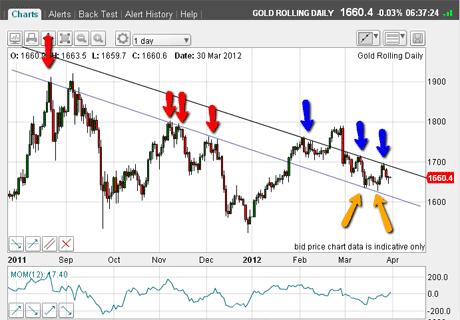
What I want to show you now are some superb tramlines on the daily chart going back to last summer. Take a look at this:
(Click on the chart for a larger version)
See how my lower tramline passes across the major touch points as marked by my red arrows. It also brings in the recent lows as marked by the yellow arrows.
Isn't that pretty? This is very strong support and should continue to repel declines that is, until it doesn't!
But take a look at my upper tramline this is a real beauty. It passes across the recent major highs marked by the blue arrows.
So, these tramlines can be used to initiate and to exit from positions they are my targets.
But here's something even more amazing:
(Click on the chart for a larger version)
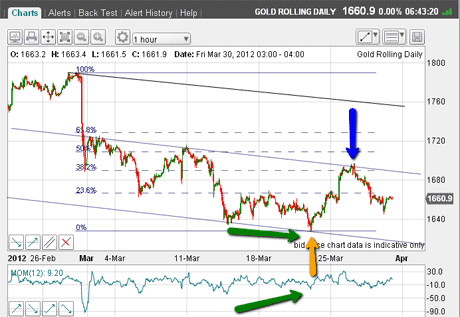
The lower tramline pair you can see is the original set. But now I can draw a third (upper) tramline at the same distance as between the lower pair. See how it passes right across the major $1,798 top. Now that is elegant.
The markets are patterned make no mistake. They are definitely not random. That is why you can make money by studying the charts. And that's what I hope to show you how to do in these posts.
Trader Tip: Be on the lookout for third tramlines remember, the golden rule is that they have to have equal spacing, as I have shown here.
Again the tramline showed me a good place to go short
But now, note the bounce off the lowest tramline (yellow arrow), which made a new low on a positive momentum divergence.
The odds were stacking up for a rally ahead and this is what we got. But it reached only the centre tramline (which was also the Fibonacci 38% retrace) before turning back down from that strong resistance.
That told me it was time for another short sale on gold!
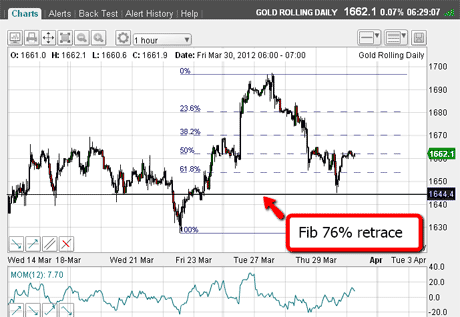
This is this morning's chart in close-up:
(Click on the chart for a larger version)
The rally off the most recent $1,630 low took gold to the Tuesday $1,697 high in a clear A-B-C form and then started a decline. So far, so good.
The next question: where to take profits on my new short sale?
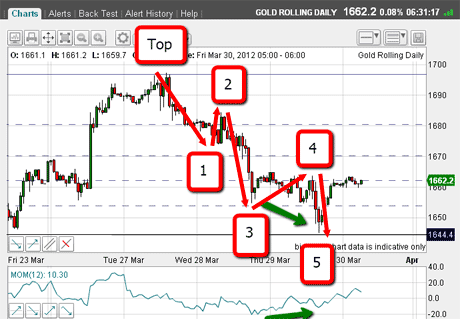
Take a look at this close-up chart:
(Click on the chart for a larger version)
You can see that there is a clear five-wave form to the decline from the top complete with a positive momentum divergence (green arrows) at the fifth wave.
In addition, the decline has taken it to a precise Fibonacci 76% retrace as marked by the solid line at $1,644.
That was the place for me to exit!
The market did bounce off this level, so now I can place a new Fibonacci set using the recent low as low pivot:
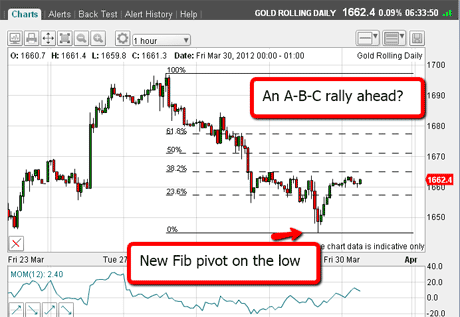
(Click on the chart for a larger version)
It's time for me to stand aside and wait for a better trade
So what am I now looking for? That's right an A-B-C rally.
But I may not get it, as the centre tramline at the $1,690 area beckons!Certainly, a break above this level should propel the market much higher.Remember what I said about the bears awakening from hibernation?
On this decline, I have the feeling that some traders have been emboldened to add to their short positions. I shall be monitoring the Commitments of Traders (COT) data closely. If true, we could see some large up-swings as those short positions are covered (ie, gold is bought).
I've just booked some nice profits from the short side on gold. My policy now is to stand aside and watch. Remember, there's nothing wrong with that, if you don't have high conviction. Just wait for a clearer picture.
If you're a new reader, or need a reminder about some of the methods I refer to in my trades, then do have a look at my introductory videos:
The essentials of tramline trading
An introduction to Elliott wave theory
Advanced trading with Elliott waves
Don't miss my next trading insight. To receive all my spread betting blog posts by email, as soon as I've written them, just sign up here .
Get the latest financial news, insights and expert analysis from our award-winning MoneyWeek team, to help you understand what really matters when it comes to your finances.
John is is a British-born lapsed PhD physicist, who previously worked for Nasa on the Mars exploration team. He is a former commodity trading advisor with the US Commodities Futures Trading Commission, and worked in a boutique futures house in California in the 1980s.
He was a partner in one of the first futures newsletter advisory services, based in Washington DC, specialising in pork bellies and currencies. John is primarily a chart-reading trader, having cut his trading teeth in the days before PCs.
As well as his work in the financial world, he has launched, run and sold several 'real' businesses producing 'real' products.
-
 MoneyWeek Talks: The funds to choose in 2026
Podcast Fidelity's Tom Stevenson reveals his top three funds for 2026 for your ISA or self-invested personal pension
-
 Three companies with deep economic moats to buy now
Opinion An economic moat can underpin a company's future returns. Here, Imran Sattar, portfolio manager at Edinburgh Investment Trust, selects three stocks to buy now