The FTSE sell-off shows the power of tramlines
John C Burford illustrates why his tramline trading is such a powerful technique for setting price targets and identifying market turning points.
Get the latest financial news, insights and expert analysis from our award-winning MoneyWeek team, to help you understand what really matters when it comes to your finances.
You are now subscribed
Your newsletter sign-up was successful
Want to add more newsletters?

Twice daily
MoneyWeek
Get the latest financial news, insights and expert analysis from our award-winning MoneyWeek team, to help you understand what really matters when it comes to your finances.

Four times a week
Look After My Bills
Sign up to our free money-saving newsletter, filled with the latest news and expert advice to help you find the best tips and deals for managing your bills. Start saving today!
Long-time readers will know my three favourite markets: the Dow, the euro and gold. These markets fit perfectly with my style of trading.
But they're not the only markets I can apply my trading methods to.
Today, I'm going a little off-piste by looking at the FTSE a market I've not covered for over a year.
MoneyWeek
Subscribe to MoneyWeek today and get your first six magazine issues absolutely FREE

Sign up to Money Morning
Don't miss the latest investment and personal finances news, market analysis, plus money-saving tips with our free twice-daily newsletter
Don't miss the latest investment and personal finances news, market analysis, plus money-saving tips with our free twice-daily newsletter
Why's that? It's just that the swings in the Dow suit me better. Maybe that's because it was one of the first markets I studied.
But I'm sure some readers do like to trade the FTSE. And although I rarely trade it, I do take note of it. So I hope you'll find today's issue useful.
I'll show you some terrific real-time examples of why my tramline trading technique can be so powerful for setting price targets and identifying turning points when swing trading.
Using tramlines to look for a top on the FTSE
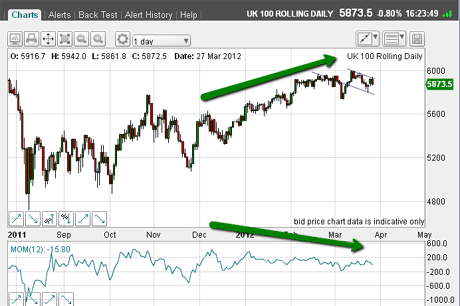
Let's start with a look at the daily chart of the FTSE going back to last summer. As you'll see, it has a similar form to that of the Dow:

(Click on the chart for a larger version)
You can clearly see the weakening momentum (green arrows) as the rally has progressed.
If you've been following me for a while, you will know that I'm expecting to see tops in stock markets very soon. I've made that case repeatedly for the Dow.
And that also applies to the FTSE, an index packed full of natural resource companies, as well as several majors in the financial services sector.
Before I get to the next chart, let me make an important point: with metals and crude oil markets in big rally phases, public interest in these markets is intense. Many pundits are calling for even bigger gains ahead. The consensus is for ever-rising prices. Hmmm.
In fact, just today, I saw a report from a major bank calling for at least $1,850 gold later this year.
But it never fails to amaze me how extreme the targets for gold become just after a good rally. You rarely hear them when the market is in free-fall! That's human nature for you. And that is why we are presented with major trading opportunities.
Most experts' simply project the trend of the recent past into the distant future in a straight line. That is why major turning points come as a shock to most people.
But that does not have to happen to you! I'm showing how turning points can be identified with high accuracy using my simple, proven trading methods.
See how the FTSE ran into major resistance and turned sharply down
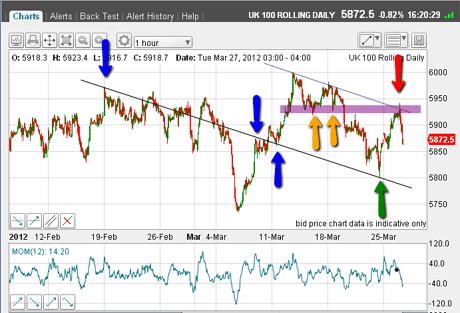
Let's get back to the FTSE. Here's a chart I took yesterday:

(Click on the chart for a larger version)
It shows the hourly chart going back to early last month and the big congestion zone created during this time.
I have drawn a truly super pair of tramlines. The lower one sports the lovely touch-points marked by the blue arrows; it also brings in the recent low marked by the green arrow.
This is where the FTSE found solid support and bounced right back up to kiss the upper tramline, and is currently retreating with force.
See how this latest rally also ran into the overhead resistance as marked by the purple bar. That bar corresponds to the lows, shown by the yellow arrows.
That's a powerful combination of chart and tramline resistance enough to turn the market around very sharply yesterday.
Note that I put in my upper tramline (with the two previous highs) before the rally had reached that point. I could then set my upper target with this knowledge right at the 5,940 area. See the power of the tramline!
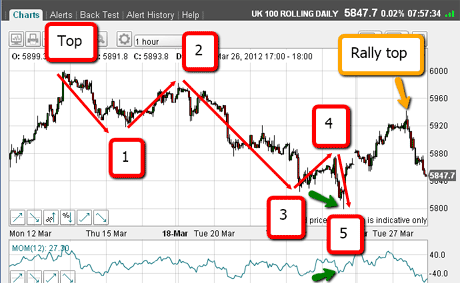
But that's not all! Just look closely at the form of the decline off the upper tramline:

(Click on the chart for a larger version)
It sports a clear five-wave Elliott wavepattern complete with a long and strong' wave 3 and the positive momentum divergenceat the fifth wave (green arrows).
This is a strong clue the trend has now changed to down. This is textbook Elliott wave theory!
Now, after a fifth wave comes a rally, hopefully in an A-B-C format.
And that is exactly what is happening. Just admire the A-B-C form to the rally up to yesterday's marked rally top.
Now, I love to short a market near the C-wave highs in upward corrections. And all of my other analysis I show here gave me a precise entry point the 5,940 area!
Is the FTSE set to enter a new bear market phase?
When putting on the trade, I protected it with my 3% rule stop, of course. And this morning I've moved my stop down to break-even since the market has moved almost 100 pips in my favour. No matter what happens, I will suffer no loss on this trade.
And if I am stopped out, it means that my analysis is wrong and a trek back to the drawing board would be necessary.
But if I am correct in my analysis, then any rally should not approach the 5,940 level. We'll see.
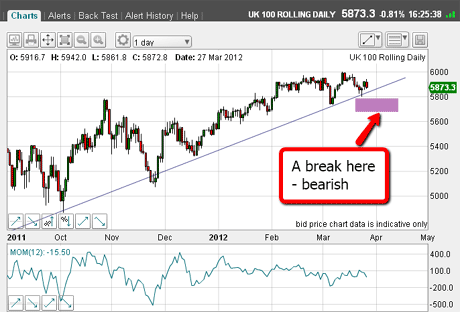
This is the daily chart showing the uptrend line that, if broken, should spell the end of the current rally phase, and the start of a large bear market move:

(Click on the chart for a larger version)
So that's where we are now. We'll soon see whether the FTSE is ready for a bigger fall.
I hope you found today's analysis of the FTSE useful. Let me know your thoughts below.
By the way, gold is also showing terrific tramlines similar to these in the FTSE. I hope to get to that market on Friday.
If you're a new reader, or need a reminder about some of the methods I refer to in my trades, then do have a look at my introductory videos:
The essentials of tramline trading
An introduction to Elliott wave theory
Advanced trading with Elliott waves
Don't miss my next trading insight. To receive all my spread betting blog posts by email, as soon as I've written them, just sign up here .
Get the latest financial news, insights and expert analysis from our award-winning MoneyWeek team, to help you understand what really matters when it comes to your finances.
John is is a British-born lapsed PhD physicist, who previously worked for Nasa on the Mars exploration team. He is a former commodity trading advisor with the US Commodities Futures Trading Commission, and worked in a boutique futures house in California in the 1980s.
He was a partner in one of the first futures newsletter advisory services, based in Washington DC, specialising in pork bellies and currencies. John is primarily a chart-reading trader, having cut his trading teeth in the days before PCs.
As well as his work in the financial world, he has launched, run and sold several 'real' businesses producing 'real' products.
-
 ISA fund and trust picks for every type of investor – which could work for you?
Whether you’re an ISA investor seeking reliable returns, looking to add a bit more risk to your portfolio or are new to investing, MoneyWeek asked the experts for funds and investment trusts you could consider in 2026
-
 The most popular fund sectors of 2025 as investor outflows continue
It was another difficult year for fund inflows but there are signs that investors are returning to the financial markets