The GBP/USD market is following my script
Applying Elliott wave theory to the charts has predicted the pound / dollar market to a tee, says John C Burford. So, where to next for the pound?
Get the latest financial news, insights and expert analysis from our award-winning MoneyWeek team, to help you understand what really matters when it comes to your finances.
You are now subscribed
Your newsletter sign-up was successful
Want to add more newsletters?

Twice daily
MoneyWeek
Get the latest financial news, insights and expert analysis from our award-winning MoneyWeek team, to help you understand what really matters when it comes to your finances.

Four times a week
Look After My Bills
Sign up to our free money-saving newsletter, filled with the latest news and expert advice to help you find the best tips and deals for managing your bills. Start saving today!
On Friday, I made a case for a turn in GBP/USD in the 1.57 area, based on a simple application of a wave relationship rule within Elliott wave theory.
This was the picture then:
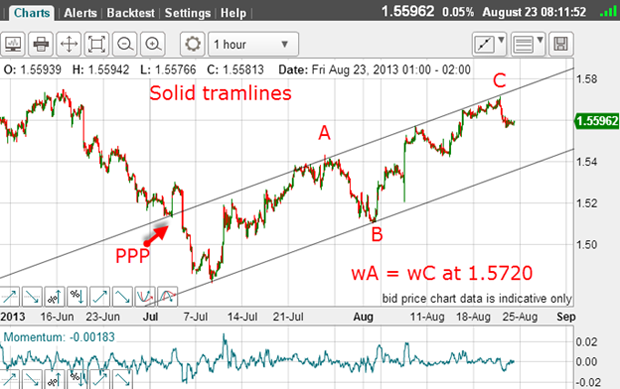
There's a clear A-B-C form to the rally, confirming it as a counter-trend move. And at 1.5720, the A wave height is equal to that of the C wave.
MoneyWeek
Subscribe to MoneyWeek today and get your first six magazine issues absolutely FREE

Sign up to Money Morning
Don't miss the latest investment and personal finances news, market analysis, plus money-saving tips with our free twice-daily newsletter
Don't miss the latest investment and personal finances news, market analysis, plus money-saving tips with our free twice-daily newsletter
And at the 1.57 level, the market had touched the resistance provided by my upper tramline. This was a terrific trade set-up low risk. Protective stops could be placed just above the upper tramline in case the rally extended.
And we must always allow for the (reduced) possibility that the rally could extend further. If the wave A = wave C equality did not hold, then the next common relationship is for wave C to be 1.618 times wave A.
But here, the market did turn and when I left it on Friday, I had a confirming five waves down on the 15-minute chart, and was looking for an A-B-C bounce.
This was the chart then:
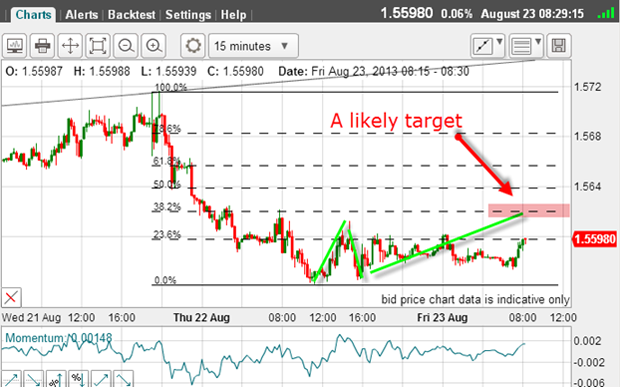
So how did my best guess work out?
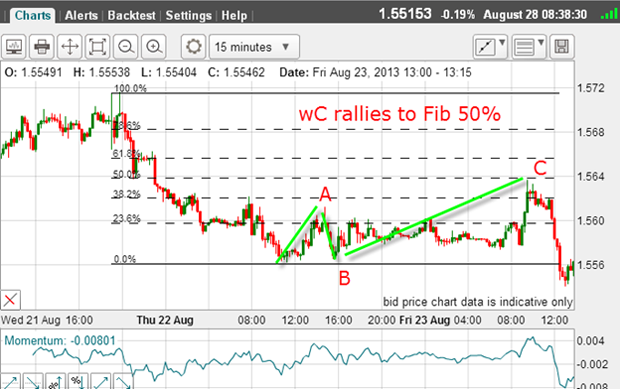
Yes, I did get my push up to the Fibonacci 38% level, and the market overshot that and made it to the 50% level, where it was turned back.
However, my idea was correct for an A-B-C counter-trend rally to confirm the trend was now down.
Good risk/reward on offer
So, if we are in a downtrend, where is my first major target?
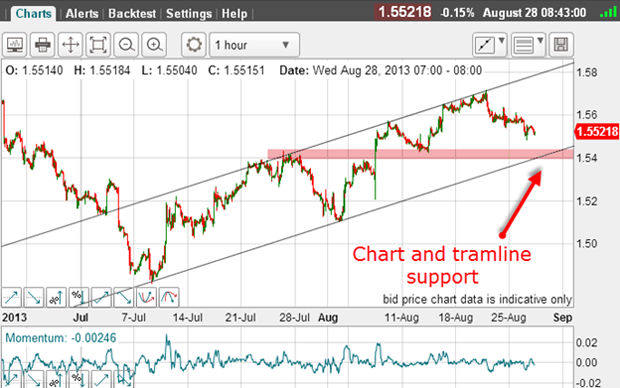
My lower tramline is my target. That is where I think the next major support lies.
There is chart support as well as tramline support, so this will be a tough barrier to break through.
Being short around 1.5650 and assuming my target is hit would provide me a profit of around 250 pips with the original risk of about 40 pips.
In the meantime, stops can be lowered to break-even.
When I can find trades with this generous level of reward/risk, I don't hesitate to take them!
I have noticed a similar pattern in another currency cross that I follow the USD/JPY.
Take a look at the hourly chart of USD/JPY:
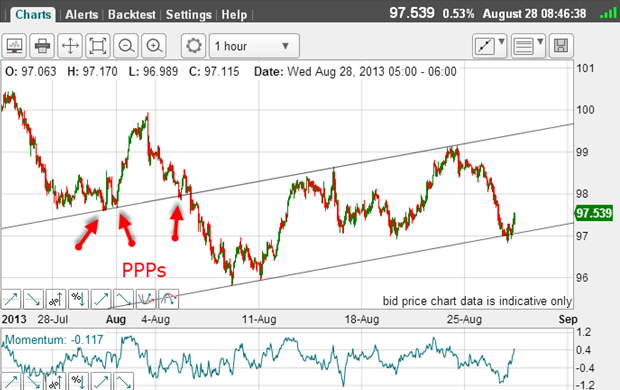
I have a similar tramline pair where the upper tramline has a lovely prior pivot point (PPP), as in the GBP/USD. In fact, it has three PPPs (red arrows), making this tramline a secure line of resistance.
And sure enough, last week, when the market rallied to the 99 level, it hit a brick wall and rapidly retreated down to the lower tramline in haste.
Now the market is testing the support provided by the lower tramline, so that a short trade near the upper line would be in profit by around 200 pips already.
Look out for these set-ups because they offer great trades with high reward/risk ratios.
Stay up to date with MoneyWeek:Follow us onTwitter,FacebookandGoogle+
Get the latest financial news, insights and expert analysis from our award-winning MoneyWeek team, to help you understand what really matters when it comes to your finances.
John is is a British-born lapsed PhD physicist, who previously worked for Nasa on the Mars exploration team. He is a former commodity trading advisor with the US Commodities Futures Trading Commission, and worked in a boutique futures house in California in the 1980s.
He was a partner in one of the first futures newsletter advisory services, based in Washington DC, specialising in pork bellies and currencies. John is primarily a chart-reading trader, having cut his trading teeth in the days before PCs.
As well as his work in the financial world, he has launched, run and sold several 'real' businesses producing 'real' products.
-
 Can mining stocks deliver golden gains?
With gold and silver prices having outperformed the stock markets last year, mining stocks can be an effective, if volatile, means of gaining exposure
-
 8 ways the ‘sandwich generation’ can protect wealth
People squeezed between caring for ageing parents and adult children or younger grandchildren – known as the ‘sandwich generation’ – are at risk of neglecting their own financial planning. Here’s how to protect yourself and your loved ones’ wealth.