Take advantage of a rare pattern in GBP/USD
Occasionally, the charts give you a clear signal of where the market is going to turn. Take full advantage, says John C Burford. Here's how.
Get the latest financial news, insights and expert analysis from our award-winning MoneyWeek team, to help you understand what really matters when it comes to your finances.
You are now subscribed
Your newsletter sign-up was successful
Want to add more newsletters?

Twice daily
MoneyWeek
Get the latest financial news, insights and expert analysis from our award-winning MoneyWeek team, to help you understand what really matters when it comes to your finances.

Four times a week
Look After My Bills
Sign up to our free money-saving newsletter, filled with the latest news and expert advice to help you find the best tips and deals for managing your bills. Start saving today!
Every once in a while it's possible to predict when a corrective Elliott wave will end. That's exactly what I'm going to do in today's issue.
This set-up does not happen often. But when it does, I always take full advantage.
I have been looking for a top in cable the GBP/USD cross since the early July low around 1.48. Since then, the rally has carried to a recent 1.57 point, which is a gain of nine cents in about six weeks.This is an area where major resistance lies.
MoneyWeek
Subscribe to MoneyWeek today and get your first six magazine issues absolutely FREE

Sign up to Money Morning
Don't miss the latest investment and personal finances news, market analysis, plus money-saving tips with our free twice-daily newsletter
Don't miss the latest investment and personal finances news, market analysis, plus money-saving tips with our free twice-daily newsletter
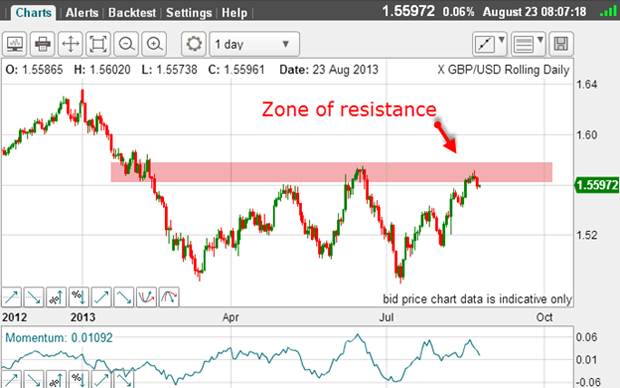
So, where to start looking?
First, the hourly chart shows the rally is complex, but the overall shape is a clear A-B-C:
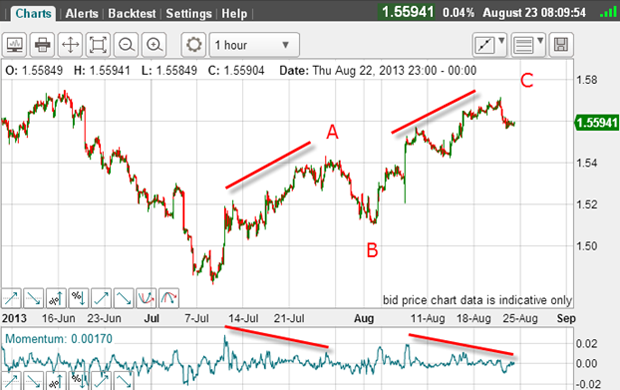
This confirms that the rally off the July low is corrective and the next big move is very likely down.
This is the direction I wish to trade.
Second, the A wave is precisely equal to the C wave at the 1.57 high (at 1.5720). This is very powerful information, since A and C wave equality is very common.
That is one of the most valuable insights you can take from basic Elliott wave theory. And it does come in handy here.
Also, one major feature of the A and C waves is how similar they are in overall shape.
And each of them sports a large negative-momentum divergence a sign of a weakening trend as the waves approach their tops.
My next task is to try to find any tramlines that make sense.
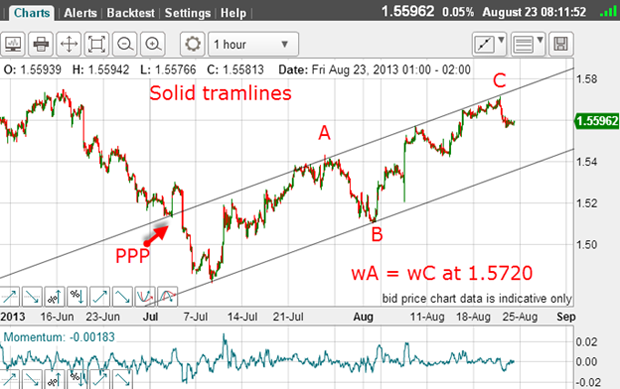
Right away, I have found a solid tramline pair and the rally to the 1.57 area has hit the upper tramline. Remember, this is a line of resistance.
So, with wave A = wave C at the 1.57 area, and the market having reached the upper tramline, this is where I'd consider placing a short trade. This is the end of the corrective Elliott wave.
Finding an entry point
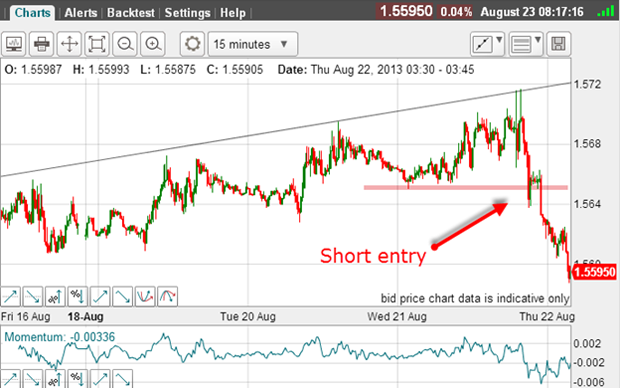
You can see that the market had two attempts to rally past the wave equality 1.5720 level, but was turned back and fell below the minor low at the 1.5650 level where an entry short trade would be placed.
Note that the C wave came within three pips of the 1.5720 target a miss of 0.02%. Now I call that a direct hit.
Aggressive traders with this knowledge would be shorting heavily close to the rally tops.
My entry method here is a more conservative approach, and my protective stop is just above 1.5720.
If I have nailed the top, I need to see a small-scale five-wave pattern down to confirm. Is it there?
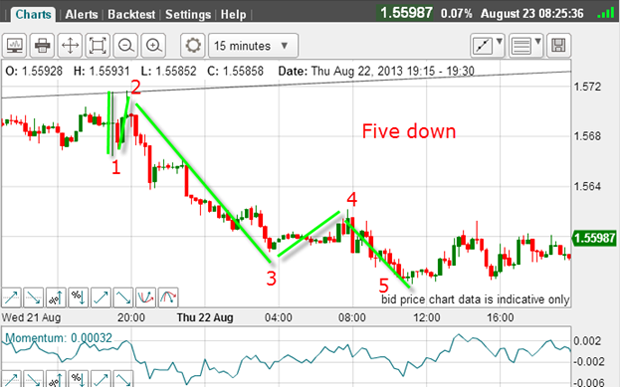
Remember, this is the method I used on Wednesday to confirm the new trend in the Dow.
Yes, I have a rather unusual five down, but it is there. That indicates the trend is now down.
OK, after a five down, I believe I will see a three up and here is the chart as I write:
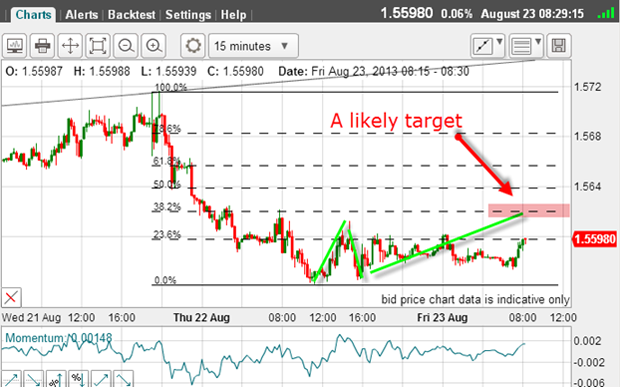
The market is attempting a rally but is currently stuck at the Fibonacci 23% level. If this resistance holds, then I expect a rapid decline beneath yesterday's low.
But my best guess is for a little more rally to the 38% level, where there will be a Fibonacci wave relationship within the rally phase.
Can you spot it?
Get the latest financial news, insights and expert analysis from our award-winning MoneyWeek team, to help you understand what really matters when it comes to your finances.
John is is a British-born lapsed PhD physicist, who previously worked for Nasa on the Mars exploration team. He is a former commodity trading advisor with the US Commodities Futures Trading Commission, and worked in a boutique futures house in California in the 1980s.
He was a partner in one of the first futures newsletter advisory services, based in Washington DC, specialising in pork bellies and currencies. John is primarily a chart-reading trader, having cut his trading teeth in the days before PCs.
As well as his work in the financial world, he has launched, run and sold several 'real' businesses producing 'real' products.
-
 ISA fund and trust picks for every type of investor – which could work for you?
Whether you’re an ISA investor seeking reliable returns, looking to add a bit more risk to your portfolio or are new to investing, MoneyWeek asked the experts for funds and investment trusts you could consider in 2026
-
 The most popular fund sectors of 2025 as investor outflows continue
It was another difficult year for fund inflows but there are signs that investors are returning to the financial markets