Could the Dow soon produce the trade of the decade?
The Dow Jones could be heading for a severe decline, says John C Burford. Here he looks forward to an exciting summer in the markets and what he believes may be the trade of the decade.
Get the latest financial news, insights and expert analysis from our award-winning MoneyWeek team, to help you understand what really matters when it comes to your finances.
You are now subscribed
Your newsletter sign-up was successful
Want to add more newsletters?

Twice daily
MoneyWeek
Get the latest financial news, insights and expert analysis from our award-winning MoneyWeek team, to help you understand what really matters when it comes to your finances.

Four times a week
Look After My Bills
Sign up to our free money-saving newsletter, filled with the latest news and expert advice to help you find the best tips and deals for managing your bills. Start saving today!
As promised, I am covering the Dow today. Since my last post of 24 May, there have been some massive swings. And I'm sure they caught many traders on the hop. Luckily, I have been able to keep on top of most of them, as I will explain.
One of the keys to trading the Dow is tracking trader sentiment. In previous articles, I have listed the various ways this important factor is measured.
One of my favourites is the American Association of Individual Investors surveys.
MoneyWeek
Subscribe to MoneyWeek today and get your first six magazine issues absolutely FREE

Sign up to Money Morning
Don't miss the latest investment and personal finances news, market analysis, plus money-saving tips with our free twice-daily newsletter
Don't miss the latest investment and personal finances news, market analysis, plus money-saving tips with our free twice-daily newsletter
These track the sentiment of retail investors. The basic rule is that when we see extremes of either bullish or bearish sentiment, we are close to a major market turn.
This is the latest reading as of 6 June:
| Bulls | 27% | -1% | 39% |
| Bears | 46% | 4% | 30% |
| Neutral | 27% | -3% | 31% |
Since the market made its major high on 1 May, retail investors have turned more and more bearish, from a pronounced bullish stance. I pointed out then that I had never seen such large swings in sentiment in rapid succession before.
Compare the readings with the long-term average. Remember, we have been in bull markets for most of the past several decades, and so a bias to bullishness is to be expected. The vast majority of investors have bought shares, and so tend to have a bullish bias.
But now, we have a ratio of 1.7 bears to bulls an extreme. And this bearish bias is also shown by professional money managers.
A 500-point gift from the Dow
So this explains the large swings in the Dow, does it not? The bears have been driving the market down, while market professionals have been rallying the market to light the blue touch-paper under their buy stops the classic short squeeze.
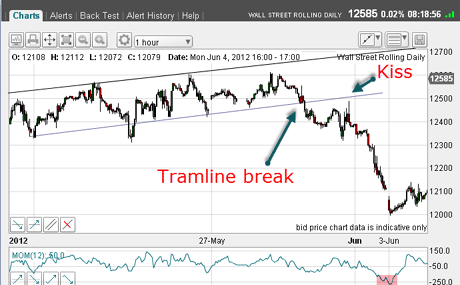
When I left it on 24 May, I showed the very rare multi-tramlines on the 15-minute charts. I wrote: "But with sentiment extremely bearish, there may be one more surprise' pop to the upside. To me, odds are even. But I would like to see a proper A-B-C, which would be achieved with a pop above 12,500. Will I get it?"
The answer I certainly did! So that satisfied my requirement for a top, and I was ready with a sell order just below the lower tramline:
(Click on the chart for a larger version)
Note the spike 'kiss' as the market rallied back to the underside of the tramline. And within three days, the market had plunged over 500 points.
What a gift and I duly took it with thanks.
Why I've stood aside from the rally
Now, with the market severely oversold (pink bar), I expected a rally. But how high would it go? At that stage, I had no idea it would shoot above the 12,600 level on Monday as it reacted to the Spanish bank bail-out news.
But with trader sentiment so bearish, I expected sharp rallies within the bear market as shorts were being squeezed. But this one was a doozy!
For that reason, I decided to stand aside from this rally and watch developments.
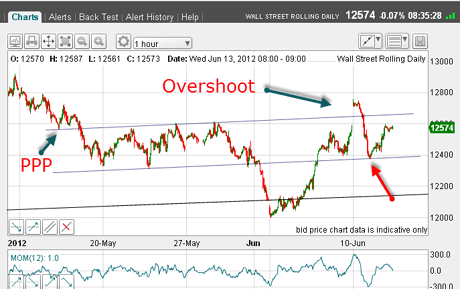
On Monday, as the market made that huge gap up opening, I decided to try to find some meaningful tramlines and here they are:
(Click on the chart for a larger version)
I had my prior pivot point (PPP) and that upper tramline passed over the major tops in May, and produced Monday's overshoot. My centre tramline was speculative, as was my lowest tramline. I did not have a great deal of confidence in the lower two.
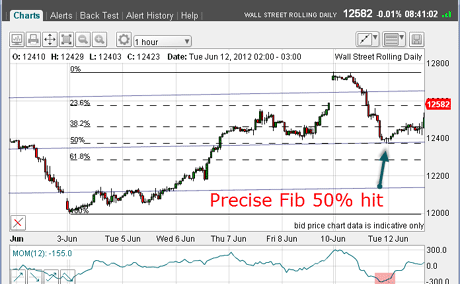
But when Monday's selling brought the market down to the centre tramline and then bounced my confidence in them shot up. Let's take a closer look :
(Click on the chart for a larger version)
The market came down to a precise Fibonacci 50% retrace and then bounced and note the oversold momentum reading.
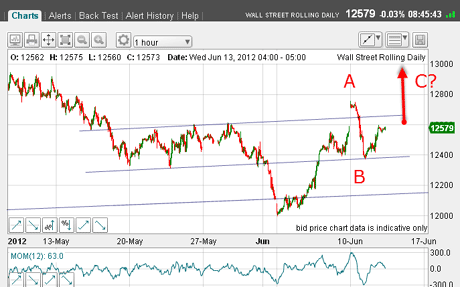
Since we are still dealing with rallies in a bear market, the preferred form of the rally should be an A-B-C. Do we have one yet? I think not.
Therefore, I believe the odds favour a move up beyond Monday's high:
(Click on the chart for a larger version)
This is my tentative roadmap with the C wave ending above the A wave before the bear market resumes. If so, more short squeezing lies ahead.
Could this be the trade of the decade?
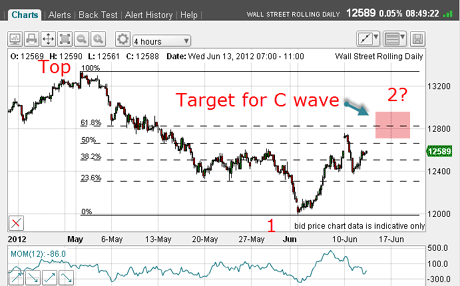
Now let's have a look at what this implies in thefour-hour chart:
(Click on the chart for a larger version)
If a new high lies ahead, my target zone surrounds the Fibonacci 62% retrace, preferably accompanied by a negative momentum divergence.
Then, I can say my large Elliott wave 1 is the 4 June low, and my wave 2 will be the C wave high.
If this pans out, shorting near the C wave high could be one of the trades of the decade, as a massive third wave down beckons
But first, the market looks like it will be squeezing out more weak shorts who will be covering on the way up. This should pave the way for a severe decline.
This promises to be a very exciting summer.
On Friday, I hope to cover gold, which also is showing some interesting moves and an important tramline test.
Why it pays to be a swing trader
Finally a quick note on trading. In the last week I've avoided the worst of the carnage. But that is because I approached this week as a swing trader; not a position investor. I wrote on this last week. For me, preservation of capital rules above all else.
To illustrate the dangers of position (long-term buy-and-hold) investing, I read today that Anthony Bolton, the famed Fidelity fund manager, has managed to lose over 24% in his China fund in the past year.
I don't know about you, but this type of investing just doesn't appeal. It is all very well saying or more honestly, praying that it will do well in the future. But that smacks of rationalisation to save face.
In truth, no-one knows what a fund or any financial market will do in the future with anything approaching certainty. It could go down 50% or more. It could double.
My point is that a loss is a loss is a loss, and any investor who puts their faith and it is faith in a star manager, is in a state of denial when faced with this reality.
On the other hand, in spread betting, because of the high leverage, we are unable to be in denial for very long. The margin clerk's call will do the trick!
If you're a new reader, or need a reminder about some of the methods I refer to in my trades, then do have a look at my introductory videos:
The essentials of tramline trading
An introduction to Elliott wave theory
Advanced trading with Elliott waves
Don't miss my next trading insight. To receive all my spread betting blog posts by email, as soon as I've written them, just sign up here .
Get the latest financial news, insights and expert analysis from our award-winning MoneyWeek team, to help you understand what really matters when it comes to your finances.
John is is a British-born lapsed PhD physicist, who previously worked for Nasa on the Mars exploration team. He is a former commodity trading advisor with the US Commodities Futures Trading Commission, and worked in a boutique futures house in California in the 1980s.
He was a partner in one of the first futures newsletter advisory services, based in Washington DC, specialising in pork bellies and currencies. John is primarily a chart-reading trader, having cut his trading teeth in the days before PCs.
As well as his work in the financial world, he has launched, run and sold several 'real' businesses producing 'real' products.
-
 Average UK house price reaches £300,000 for first time, Halifax says
While the average house price has topped £300k, regional disparities still remain, Halifax finds.
-
 Barings Emerging Europe trust bounces back from Russia woes
Barings Emerging Europe trust has added the Middle East and Africa to its mandate, delivering a strong recovery, says Max King