A rare multiple tramline set-up on the Dow
The recent hyper-activity in the Dow has thrown up a very rare and exciting phenomenon, says John C Burford. Does the market hold any further surprises?
Get the latest financial news, insights and expert analysis from our award-winning MoneyWeek team, to help you understand what really matters when it comes to your finances.
You are now subscribed
Your newsletter sign-up was successful
Want to add more newsletters?

Twice daily
MoneyWeek
Get the latest financial news, insights and expert analysis from our award-winning MoneyWeek team, to help you understand what really matters when it comes to your finances.

Four times a week
Look After My Bills
Sign up to our free money-saving newsletter, filled with the latest news and expert advice to help you find the best tips and deals for managing your bills. Start saving today!
It's not often I write three days in a row. But the markets are thrilling right now and there are lessons to be learned.
So this is a very brief follow-up to yesterday's post on the Dow.
Today, I thought you'd be amused by this very unusual case where six tramlines are in play on the Dow. This is very rare.
MoneyWeek
Subscribe to MoneyWeek today and get your first six magazine issues absolutely FREE

Sign up to Money Morning
Don't miss the latest investment and personal finances news, market analysis, plus money-saving tips with our free twice-daily newsletter
Don't miss the latest investment and personal finances news, market analysis, plus money-saving tips with our free twice-daily newsletter
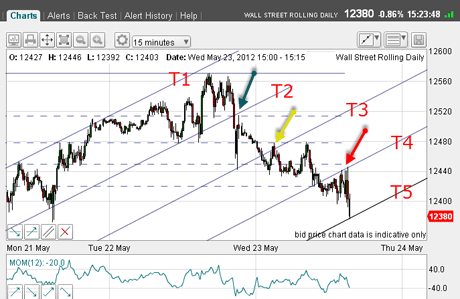
Yesterday, I drew a tramline trio, marked T1, T2, and T3.
As the market fell hard in the afternoon, I could draw in more tramlines as usual, each one equidistant from the previous one.
Note how the market sliced through all of them including the most recent T4 and T5 but is respecting their placement, as every time, the market has come back for a kiss (blue, yellow and red arrows).

(Click on the chart for a larger version)
As I wrote this yesterday, the market had collapsed to hit T5 on the nose. The above chart was taken at around 3:30pm yesterday.
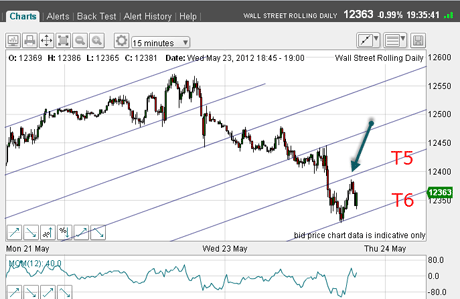
And here is the later chart showing the drop to yesterday's low right on T6. Remember, I could draw T5 and T6 when T1, T2 and T3 were in place!

(Click on the chart for a larger version)
Also remember, tramlines are targets, but not all tramlines are turning points.
Note also the attempt to kiss T5 after T6 was achieved. To protect profits, stops could be placed above the high marked by the green arrow.
So where now for the Dow?
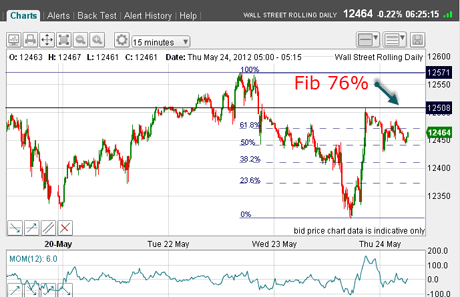
Here is the situation this morning following the sharp late-day rally:

(Click on the chart for a larger version)
The rally carried right to the Fibonacci 76% retrace, at 12,508 another superb Fibonacci target hit to add to all those I have shown recently. And profits were locked in on the short trades taken at the 12,570 level.
Now the market is consolidating as I write. And note the possible A-B-C form to the rally, suggesting it may possibly have ended.
But with sentiment extremely bearish, there may be one more surprise' pop to the upside. To me, odds are even. But I would like to see a proper A-B-C, which would be achieved with a pop above 12,500. Will I get it?
If you're a new reader, or need a reminder about some of the methods I refer to in my trades, then do have a look at my introductory videos:
The essentials of tramline trading
An introduction to Elliott wave theory
Advanced trading with Elliott waves
Don't miss my next trading insight. To receive all my spread betting blog posts by email, as soon as I've written them, just sign up here .
Get the latest financial news, insights and expert analysis from our award-winning MoneyWeek team, to help you understand what really matters when it comes to your finances.
John is is a British-born lapsed PhD physicist, who previously worked for Nasa on the Mars exploration team. He is a former commodity trading advisor with the US Commodities Futures Trading Commission, and worked in a boutique futures house in California in the 1980s.
He was a partner in one of the first futures newsletter advisory services, based in Washington DC, specialising in pork bellies and currencies. John is primarily a chart-reading trader, having cut his trading teeth in the days before PCs.
As well as his work in the financial world, he has launched, run and sold several 'real' businesses producing 'real' products.
-
 Inheritance tax investigations net HMRC an extra £246m from bereaved families
HMRC embarked on almost 4,000 probes into unpaid inheritance tax in the year to last April, new figures show, in an increasingly tough crackdown on families it thinks have tried to evade their full bill
-
 Average UK house price reaches £300,000 for first time, Halifax says
While the average house price has topped £300k, regional disparities still remain, Halifax finds.