Forget Facebook – here’s where the real trading action is
Faced with stock-market volatility, John C Burford uses his Fibonacci trading methods to seek out low-risk entry positions to short the Dow.
Get the latest financial news, insights and expert analysis from our award-winning MoneyWeek team, to help you understand what really matters when it comes to your finances.
You are now subscribed
Your newsletter sign-up was successful
Want to add more newsletters?

Twice daily
MoneyWeek
Get the latest financial news, insights and expert analysis from our award-winning MoneyWeek team, to help you understand what really matters when it comes to your finances.

Four times a week
Look After My Bills
Sign up to our free money-saving newsletter, filled with the latest news and expert advice to help you find the best tips and deals for managing your bills. Start saving today!
"If I could avoid a single stock, it would be the hottest stock in the hottest industry, the one that gets the most favourable publicity, the one that every investor hears about in the car pool or on the commuter trainand succumbing to the social pressure, often buys." Peter Lynch, Money Manager, One Up On Wall Street.
Lynch published his classic book in 1989. But the above quote could easily have been directed at Facebook, the ex-darling of NASDAQ.
I say ex-darling' as Facebook shares closed last night at $31 against an issue price of $38 and down 31% from last Friday's $45 post-IPO high.
MoneyWeek
Subscribe to MoneyWeek today and get your first six magazine issues absolutely FREE

Sign up to Money Morning
Don't miss the latest investment and personal finances news, market analysis, plus money-saving tips with our free twice-daily newsletter
Don't miss the latest investment and personal finances news, market analysis, plus money-saving tips with our free twice-daily newsletter
If you can get hold of a five-minute chart of Facebook, you will see a lovely five-wave down-move off the initial $45 high. Thus, a short term (A-B-C?) rally is likely very soon. But the five-wave down-move spells big trouble for Facebook.
But this isn't the kind of market I like to trade. So let's get back to reality and a market I use regularly to take spread betting profits.
Today, I want to stick with the Dow. All being well, I'll aim to bring in the euro in Friday's MoneyWeek Trader there's some great action there, too.
The Dow's Monday rally forces me to take profits
The Dow is remarkable. We're seeing serious action and it's offering Fibonacci traders terrific low-risk entries galore, which I mentioned in Monday'spost and continues to do so. So let's see what the latest offerings are.
On Monday, I made a case for a rally, and that is what we got.

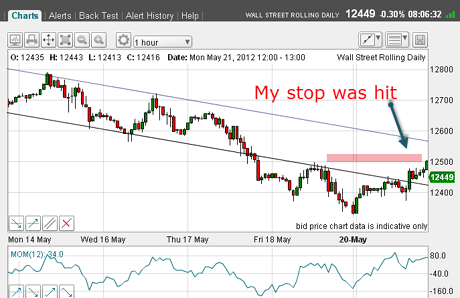
(Click on the chart for a larger version)
My 'danger zone' was in the area above the lower tramline and on Monday afternoon, my protect-profit stop was hit for a very sizeable gain.
The question now arose: Are these tramlines still working? After all, we had a textbook tramline kiss and scalded cat bounce down on Friday, but the market showed no follow-through, as I would normally expect. This sowed the doubt in my mind.
OK, I had banked my gains and the other question I had was: How high will the rally go?
After all, we are in a bear market and most likely in a third Elliott wave down (see Monday's post). If correct, any rallies should be sharp and swift, but quickly retraced.
Why I still favour short positions on the Dow
Thus, I will continue to seek shorting opportunities, and avoid long trades at least for now. Of course, if the charts tell me to change that's what I'll do.
I decided to observe action for a while to see how the rally played out. I didn't have to wait very long for a clue and this is where I swung in my Fibonacci weapon again.
Normally, the choice of pivot points is reasonably straightforward as the highs and lows are unambiguous (within reason).
But not here!
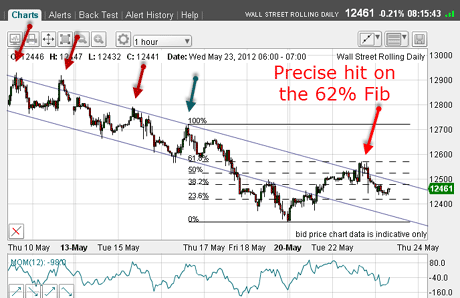
If you look at the chart below and examine the various closely-spaced highs marked by the red arrows, I am spoiled for choice. What to do?
But if I follow my rule to select the most recent high and low, I choose the high on the blue arrow. The low selects itself.

(Click on the chart for a larger version)
As the market rallied yesterday, I was expecting a turn at either the 50% or the 62%. As it happened, there was some indecision around the 50%. But when the market took off again, I was waiting at the 62% level with my sell orders. I had a close protective stop, just in case.
One other clue that made the 62% level the most likely turning point was the minor low made last Wednesday. Can you spot it? These minor lows are often lines of resistance.
Trader tip: When presented with several possible pivot points for your Fibonacci analysis, go for the most recent ones first. These will give you the strongest candidates.
One other point. As you can see from that chart above, the market had pushed above the upper tramline and, normally, I would be looking at a more substantial rally and perhaps even a long trade on this tramline break.
But remembering we are most probably in that third wave down, any long trade would likely be crushed, so no thanks!
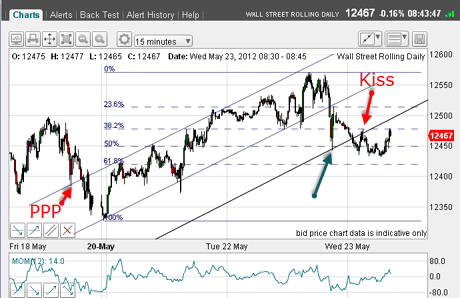
Let's now examine the decline off the 12,570 high yesterday on the 15-minute chart:

(Click on the chart for a larger version)
I can draw tramlines! My upper one has a nice prior pivot point (PPP) and cuts across several highs. My central line was broken following the 12,570 top and bottomed right on my lowest tramline! How convenient.
And with these events, it strongly validates my tramline placements.
Then, late in yesterday's session, the market rebounded to the underside of the centre tramline. Overnight, the market rejected this line and broke below the lowest line. Then it came back for a kiss and is currently trying hard to get back to it.
This could be another excellent short entry area, as it can be protected by a close stop just above the lowest tramline.
Use Fibonacci to find turning points and entry levels
Note the decline has carried down to the 50% Fibonacci retrace of the wave up to the 12,570 high and then bounced.
So you see, in the space of a week, we have been presented with many precise short entries based mainly around Fibonacci retracements where close protective stops could be used.
So make Sr Fibonacci your friend! Go over plenty of old charts and overlay your Fib tool and just admire how many times markets turn right on or close to these levels. And of course, use Fib on your current charts for those low-risk entries.
If you're a new reader, or need a reminder about some of the methods I refer to in my trades, then do have a look at my introductory videos:
The essentials of tramline trading
An introduction to Elliott wave theory
Advanced trading with Elliott waves
Don't miss my next trading insight. To receive all my spread betting blog posts by email, as soon as I've written them, just sign up here .
Get the latest financial news, insights and expert analysis from our award-winning MoneyWeek team, to help you understand what really matters when it comes to your finances.
John is is a British-born lapsed PhD physicist, who previously worked for Nasa on the Mars exploration team. He is a former commodity trading advisor with the US Commodities Futures Trading Commission, and worked in a boutique futures house in California in the 1980s.
He was a partner in one of the first futures newsletter advisory services, based in Washington DC, specialising in pork bellies and currencies. John is primarily a chart-reading trader, having cut his trading teeth in the days before PCs.
As well as his work in the financial world, he has launched, run and sold several 'real' businesses producing 'real' products.
-
 Average income tax by area: The parts of the UK paying the most tax mapped
The UK’s total income tax bill was £240.7 billion 2022/23, but the tax burden is not spread equally around the country. We look at the towns and boroughs that have the highest average income tax bill.
-
 BBC TV licence fee hike confirmed: can you reduce how much you pay?
The cost of a TV licence fee is set to rise by over 3%, but there are ways to reduce the bill.